Happy new Year to all my readers! God Bless!
Hope you have a great one! Cheers! 🙂
Category Archives: Personal
#HappyNewYear2022
Happy new Year to all! Stay Safe. God Bless!
Monitor a Linux host with Telgraf InfluxDB and Chronograf using Docker
This is a guide on how to monitor a Linux device(s) using Telgraf, InfluxDB and Chronograph. To make things easier, we will be running all these components using Docker.
Requirements:
- Docker should be installed [Note: Docker version 19.03.08 was used in this tutorial]
- Internet connectivity to pull the docker images
- Custom docker network
- Sufficient Disk space to store data in InfluxDB
1. Create a custom docker network:
-Lets create a custom docker bridge network. Below, I have created a custom docker network with the name “influxdb”.
docker network create influxdb
You can name it whatever you want. You just need to make sure that name is passed in the –net flag in other docker commands.
You can verify that the network is created using the following command:
docker network ls
-Below are the sample outputs:
extr3me@op3n:~$ docker network ls
NETWORK ID NAME DRIVER SCOPE
0d72e4098315 bridge bridge local
e3808d2b4078 host host local
d2c5b3842508 influxdb bridge local
a25ec7e0c8a2 none null local
2. Run InfluxDB:
-InfluxDB is database where all the statistics of the host will be stored. To create an instance of InfluxDB, run the following command pass the network name as well as shown below:
docker run -d --name=influxdb --net=influxdb influxdb3. Run Telegraf:
-Before you run Telegraf, you would need to create Telegraf config file. Run the below commands to generate a sample Telegraf configuration file.
mkdir telegraf
docker run --rm telegraf telegraf config > telegraf/telegraf.conf
ls telegraf/
-Modify the above telegraf.conf as per your requirement. For starters, you can un-comment the outputs.influx block and the urls section. So, the config file would have the following:
[[outputs.influxdb]]
   urls = ["http://influxdb:8086"]
-The above output block tells Telegraf where the Influxdb database is located. Once this configuration file is passed to telegraph in the next section, then Telegraf will interact with InfluxDB (read and write data) via API.
-Now that we have the configuration file ready, we can run Telegraf and pass the configuration file.
-Below I am passing /sys /proc and /etc as readonly mounts inside the container. Optionally, I have passed the docker socket as well as a bind mount so that I can monitor the resource usage of docker and the running containers too.
docker run -d --restart=always --name telegraf \
--net=influxdb --hostname=telegraf \
-e "HOST_PROC=/rootfs/proc" \
-e "HOST_SYS=/rootfs/sys" \
-e "HOST_ETC=/rootfs/etc" \
-v $(pwd)/telegraf/telegraf.conf:/etc/telegraf/telegraf.conf:ro \
-v /var/run/docker.sock:/var/run/docker.sock:ro \
-v /sys:/rootfs/sys:ro \
-v /proc:/rootfs/proc:ro \
-v /etc:/rootfs/etc:ro \
telegraf
You can add/modify the source as you wish to monitor more data. You just need to make sure that the the necessary mounts/variables are passed as well.
4. Run Chronograf:
-Chronograf is used to visualize the data using a browser. It can talk to InfluxDB and display the data in forms of graphs etc.
-To run Chronograf, you can run the following docker command:
docker run -d --name chronograf -p 8888:8888 --net=influxdb chronograf --influxdb-url=http://influxdb:8086
-Verify all containers are running using “docker ps -a”
extr3me@op3n:~$ docker ps -a
CONTAINER ID        IMAGE               COMMAND                  CREATED             STATUS              PORTS                          NAMES
a9da408e41b0        chronograf          "/entrypoint.sh --in_"   39 seconds ago      Up 38 seconds       0.0.0.0:8888->8888/tcp         chronograf
326255e6d234        telegraf            "/entrypoint.sh tele_"   36 minutes ago      Up 36 minutes       8092/udp, 8125/udp, 8094/tcp   telegraf
51c95679a803        influxdb            "/entrypoint.sh infl_"   About an hour ago   Up About an hour    8086/tcp                       influxdb
The above output shows that all the three containers are up and running.
-Now, you can access the Chronograf Dashboard from your browser by visiting the following URL.
http://localhost:8888Once you are in the Chronograf UI, you can navigate to “Host Lists” and click on host to view the collected stats.
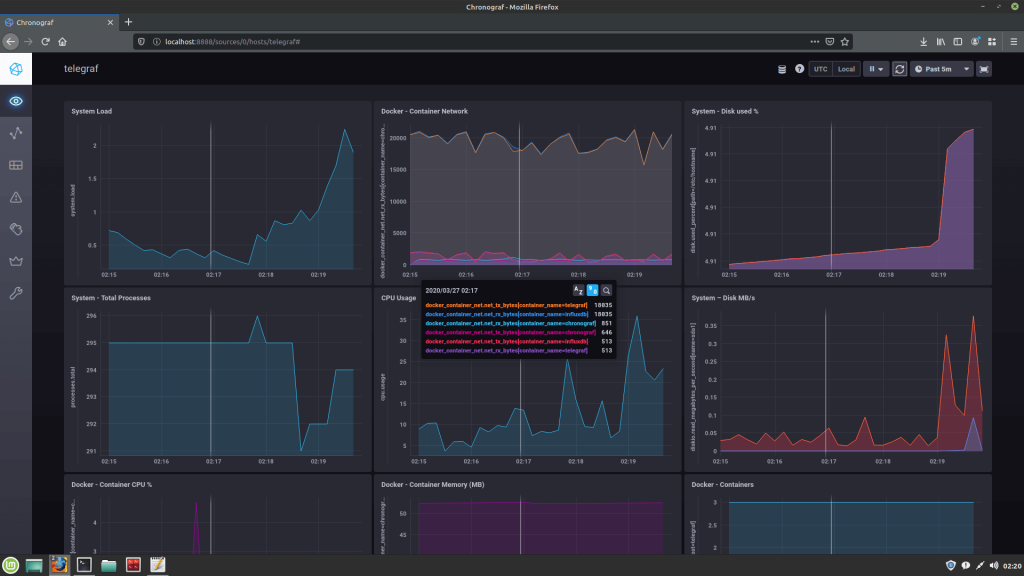
Below is a screenshot of Chronograf that is displays the host information:

Troubleshooting:
To troubleshoot API issues, you could create a sample container in same “influxdb” network and install curl in it.
For example: You could create an alpine container attached to the influxdb network.
docker run --net=influxdb -it alpine shThen install curl using “apk add curl”. Below is the sample outputs:
/ # apk add curl
fetch http://dl-cdn.alpinelinux.org/alpine/v3.11/main/x86_64/APKINDEX.tar.gz
fetch http://dl-cdn.alpinelinux.org/alpine/v3.11/community/x86_64/APKINDEX.tar.gz
(1/4) Installing ca-certificates (20191127-r1)
(2/4) Installing nghttp2-libs (1.40.0-r0)
(3/4) Installing libcurl (7.67.0-r0)
(4/4) Installing curl (7.67.0-r0)
Executing busybox-1.31.1-r9.trigger
Executing ca-certificates-20191127-r1.trigger
OK: 7 MiB in 18 packages
-Once curl is installed, Then try the following sample InfluxDB API calls pointing to the InfluxDB endpoint from within the Alpine container:
curl -i -XPOST http://influxdb:8086/query --data-urlencode "q=show databases"
-Below are sample outputs:
/ # curl -i -XPOST http://influxdb:8086/query --data-urlencode "q=show databases"
HTTP/1.1 200 OK
Content-Type: application/json
Request-Id: e58a61db-6fa6-11ea-85a3-0242ac120002
X-Influxdb-Build: OSS
X-Influxdb-Version: 1.7.10
X-Request-Id: e58a61db-6fa6-11ea-85a3-0242ac120002
Date: Thu, 26 Mar 2020 21:15:19 GMT
Transfer-Encoding: chunked

{"results":[{"statement_id":0,"series":[{"name":"databases","columns":["name"],"values":[["_internal"],["telegraf"]]}]}]}
-Here is another example on how to to check if you are able to create a database:
curl -i -XPOST http://influxdb:8086/query --data-urlencode "q=CREATE DATABASE telegraf"To troubleshoot issues related to Telegraf, you review the docker logs.
docker logs -f telegraf
To troubleshoot issues with InfluxDB, you can manually access InfluxDB’s shell/CLI and run commands (just like you would in other database servers such as MySQL.)
Below is an example on how to view the list of databases from InfluxDB shell.
docker exec -it influx sh
# influx
Connected to http://localhost:8086 version 1.7.10
InfluxDB shell version: 1.7.10
> show databases
name: databases
name
----
_internal
telegraf
I hope this helps. Do share, leave a like/comment below! Cheers!
Regards,
ΞXΤЯ3МΞ
Sources/References:
https://hub.docker.com/_/telegraf/
https://hub.docker.com/_/chronograf/
https://www.jacobtomlinson.co.uk/monitoring/2016/06/23/running-telegraf-inside-a-container/
To all my readers
To all my readers, stay @127.0.0.1 && avoid 255.255.255.255.
Hope you and your family be safe.
God Bless!
#HappyNewYear2020
Its 2020!!!! Wohoo!! Happy new year to all! God Bless you!

DIY Motion Detecting Surveillance Camera using Pi Zero W, Docker & USB Webcam
This is project build using “motion” which a software based motion detector. I have created a docker image for this project for portability reasons inside my Pi Zero W.
So what does this project do?
– If you need a surveillance system for your home you can build it yourself pretty cheap using a Raspberry PI and a webcam.
– Configure webcam it to stream and record footage full time or record only when a motion is detected.
– Moreover, this a fun project to run docker on a Pi simply to test docker for Pi Zero.
– This could be run on Pi Zero W/Pi 3/Pi 3 Model B/Banna PI/Orange Pi as well.
What not to expect?
-Well, this is a Pi zero. So, don’t expect it to render 1080p at 60fps. 😛
Requirements:
- Raspberry Pi Zero W connected to your local Wifi network [Raspberry Pi 3 is recommended.]
- Docker 18.06.1-ce installed on Pi Zero.
- USB webcam.
- Sufficient disk space on your SD to store the footage.
- Lots of patience 🙂
Setting up your Raspberry PI:
First, we need to create a folder where we need to store the footage. So, SSH into your Raspberry Pi.
Create a folder where you would like to store the footage. We will be using this folder later to map inside the docker container. Example, create a folder called “surv”.
mkdir ~/surv
Unplug any USB devices connected to your Pi, then type in the following:
dmesg -w
Plug in your USB webcam to your Raspberry PI Zero, and you should see that the webcam is connected. Below are some sample logs, that I got once I connected the usb webcam:

Additionally, you could run the following to view connected video devices:
v4l2-ctl --list-devices
ls -l /dev/video0

You should ideally see the USB webcam in the dmesg logs and in the lsusb outputs.
– Pull the docker image:
docker pull techantidote/motion
To run the docker container, run the following:
docker run -dit --net=host --privileged -v /dev/video0:/dev/video0 -v ~/surv:/footage --name watchtower techantidote/motion motion -nHere, we are passing the /dev/video0 which the camera attached to the rasbperry pi to /dev/video0.
To view the live stream, open a browser and go to:
http://ip-of-your-pi:8081
Alternative method:
If you are testing the configuration, you can try the following:
docker run -dit --net=host --privileged -v /dev/video0:/dev/video0 -v ~/surv:/footage --name watchtower techantidote/motionNow from inside the container, you can make changes to your configuration files and then start the motion service manually using the following:
service motion start
You can make now changes on the fly and then restart the motion service:
service motion restart
[Note: You may have to restart the docker container “docker start watchtower”]
I have already added the configuration files inside the docker image itself. If you need to tweak the settings such as the resolution/frame rates, you can edit the below two configuration files inside the docker container:
/etc/motion/motion.conf
/etc/default/motion
The log files for motion detection are stored in /var/log/motion/logs. If you would to view the log files real time, you run the following command:
docker exec -it watchtower tail -f /var/log/motion/logs
Conclusions:
-Running docker inside a Pi Zero for motion detection may not be the best idea.
-Flashing MotionEyeOS which is Video Surveillance OS designed to run on single board computers.
Want to contribute to this project?
If you would like to contribute to this project, feel free to reach out to me at twitter. @techantidote
Docker Image for Pi Zero W:
https://hub.docker.com/r/techantidote/motion
Credits/References:
Thanks to motion-project
Base image used for building the image => resin/rpi-raspbian:stretch
Accessing hardware device such as a camera from inside a container.
#HappyNewYear2019
Hi Everyone! Howdy? 2018 was a heck of a year. Its 2019 now !!!!!!!!!!!!!!
Happy new year to all my loyal folks! Be Safe, stay Blessed, have a good 2019!
Cheers! 🙂
Its 2018! Happy New Year
Merry Christmas
Its the time of miracles. Merry Christmas to all!!

Every sincere prayer would be heard.
God Bless you and your family. *hugs*
DIY Honor 4C earpiece and Screen replacement
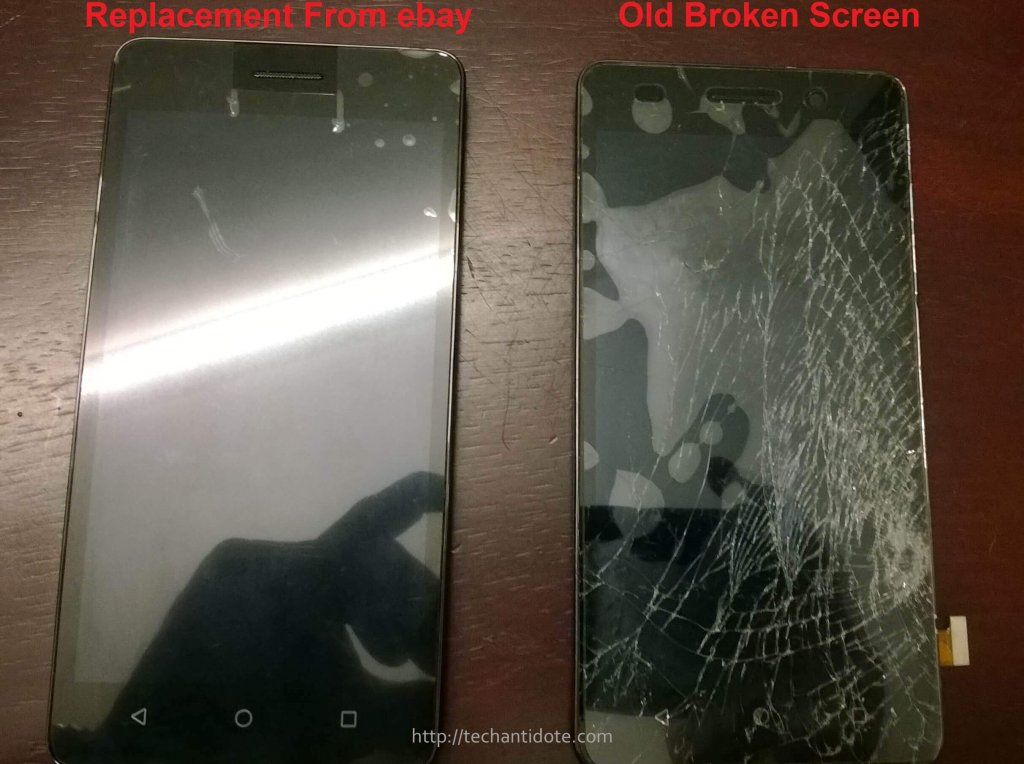
Finally, fixed my phone’s screen and broken earpiece. This is a continuation of my previous post (Disassembling my Honor 4C ) where I dismantled my old bae – Honor 4c and this is my first DIY phone repair.
Here is the repair log:
So, I bought the display and the touch screen digitizer from ebay and it got shipped in a week.

While trying to replace the screen, I accidentally damaged the earpiece (located on the top of the phone) as I pulled it out the wrong way.

The red rectangle shown below is the location of the earpiece(next to the secondary camera):

Well, that didn’t go as planned 🙁
Then, I did weeks of research trying to source the earpiece for the Honor 4c online but the earpiece was not available anywhere. Finally, I found it on aliexpress for $4.53 (Link) which was a good deal (including shipping from China).
I got the earpiece delivered in 1 month. It was actually pretty fast shipping considering it was shipped from another country and cleared customs in my country which usually takes a long time. Infact, this is my first item that I purchased from China and from aliexpress.

Dismantled the phone (again), fixed the earpiece, and mounted the display. And here comes the moment of truth!!!

Booot was successful.
Tested primary and secondary camera, wifi and earpiece and it was all back to normal. 🙂
Yaayyyy!!!
Well, this project had its ups and downs, took long to complete but am am happy that I completed it.
Regards,
ΞXΤЯ3МΞ

