Category Archives: Technology

Decoding IR Signals of a Blue Star Air Conditioner using an Arduino

This is part of my project to understand the IR protocol and try to decode IR signals that being send from my AC’s remote to the AC itself. So that the idea is: If I can figure out the different IR signals that being that transmitted, then I should be able to replay the traffic and control the Aircon from my PC or use my own custom IR hub instead of sending data to some third party – Alexa or Google Assistant. This may be applicable on other devices as well that use an IR transmitter/receiver like a TV/remote controlled fan/hubs.

Disclaimer: I am no means an electronics expert. This is just me experimenting and playing around trying to make sense of how IR works with no prior knowledge of how the protocol works. If you are electronics expert, then this post is probably not for you are better off pressing CTRL+W on your keyboard.

Requirements:

  1. KY-022 Infrared Receiver (38kHz)
  2. Arduino UNO U3
  3. Breadboard
  4. 3x Male to Male Jumper Cables.
  5. Arduino ID with IRremote library installed (Link)
  6. Computer to write your code. Duh!

Here is a picture of the KY-22 IR receiver.

ky-022 IR receiever picture

Circuit Connection:

Connect pin labelled “Y” on the KY-022 to Pin 11 on the Arduino
Connect pin labelled G to GND pin on the Arduino
Connect pin labelled R pin to the 5V pin on Arduino

-Below is the source for the IR decoder:

#include <IRremote.h>

int RECV_PIN = 11; // define input pin on Arduino.
IRrecv irrecv(RECV_PIN); 
decode_results results; // decode_results class is defined in IRremote.h

IRsend irsend; 

void setup() { 
  Serial.begin(9600); // Set Serial monitor baud rate
  irrecv.enableIRIn(); // Start the receiver 
} 

void loop() {

  if (irrecv.decode(&results)) {
    Serial.println(results.value, HEX); 
    irrecv.resume(); // Receive the next value 
  }
 
  delay(1000);
  
}

Upload the code to the Arduino and then navigate to Tools>Serial Monitor.

Now point your IR remote to the IR receiver sensor and press any key in the remote. Now, you should see the HEX value that was send from the remote in the serial console.

For example, a test case I pointed my AC’s remote to the IR receiver(KY-022) and pressed the power button. This result printed on the Serial Monitor was HEX value 90900E0A. Note: While pressing the power On button, the remote had 25 degrees set.

Here is a sample screenshot of the setup.

sending and decoding IR picture using KY-022

Here is a screenshot of the source and the data from the serial session.

arduino code and serial monitor displaying decoded IR signal

Similarly when pressing the Power Off button in the return, a different IR code of 80900C0A was send.

Hell Yeah!!!!! Ok, maybe I got excited bit too much.

I know this probably sounds dumb, but I did notice something interesting on how this is all put together. So, lets say the temperature of the AC in the remote is set to 16C. Now, if I press the “+” button to increase the temperature to 17C, then I see a different code and if I press it again again, I see a different code being send.

Here what the different hex codes for different temperatures look like(used by pressing the increment/+ sign on the remote):

Temp 16: 90000E0A
Temp 17: 90800E0A
Temp 18: 90400E0A
Temp 19: 90C00E0A
Temp 20: 90200E0A
Temp 21: 90A00E0A
Temp 22: 90600E0A
Temp 23: 90E00E0A
Temp 24: 90100E0A
Temp 25: 90900E0A
Temp 26: 90500E0A
Temp 27: 90D00E0A
Temp 28: 90300E0A
Temp 29: 90B00E0A
Temp 30: 90700E0A

Trying to make sense of IR (Sort Of):

So, in a programming point of view, I was expecting something like “new temperature” = “current temperature” + 1 and then set the value rite? Well this sort of the same with a slight difference which I guess is the way IR protocol works. So, the handheld IR remote has some logic in itself. Here is my assumption of what is happening.

  1. Say, the handheld IR remote for the Air Conditioner has current temperate as 16 degree Celsius (16C).
  2. Now lets say the user, clicks the + sign on the AC remote (IR transmitter) to increase the temperature from 16C to 17C. The IR device knows the old value as 16 from its on-board memory and now knows the new temperate has to be set to 17C. So here, the arithmetic operation i.e. increment is done on the client side i.e on the IR remote itself.
  3. The IR remote has a hard coded value of 17C somewhere in its code. The remote simply sends the IR signal with IR code for 17C. I.e. It will send 90800E0A to the IR Receiver.
  4. The IR receiver (in this case the AC), receives the IR code for 17C and then sets the temperature to 17C. Here, the AC has hardcoded values for each IR code for each temperature in its code. Something like: If “IR code received” == “90800E0A“, then set temperature to 17C.
  5. It looks more like each temperate value is hard coded and the IR remote has these values hard-coded.

Next, I will need to learn how to get a IR transmitter and replay these codes so that I can control my Aircon and other electronics from my PC. Maybe create a DIY IR hub and hook it to my PC?

So, I did buy a IR transmitter to replay the signals but the transmitter that I received was DOA. Well that went well. Haha!

ir transmitter picture

Anyways, will probably order a new transmitter to test this out post the whole COVID-19 shiZstorm.

Regards.

ΞXΤЯ3МΞ

Sources/Credits/References:

PS: Credits to Arduino modules for making it super simple to understand this. Below are credits/resources that helped out.

Arduino Modules.info
IR-Project
Duino4projects
Sparkfun
Robojax

Mount TrueNAS Core Samba share on Linux

This is a guide that describes on how to mount a remote Samba share configured on TrueNAS on to a Linux machine.


Login in your Linux machine. (I am using a Linux Mint 19.3 in this demo. This should technically work on other Debian/Ubuntu based systems as well).

Use the following commands to get your current user’s user ID (UID) and group ID (GID) respectively.

id -u $USER
id -G $USER

Create a file /etc/.truenas_creds. This is where you would store the samba credentials.

Replace text in red with the username and password of the remote SMB share which was configured in TrueNas.

cat /etc/.truenas_creds
username=enter_username_here
password=enter_password_here

Modify the file permissions so that root is the owner and set the file permission to 600.

sudo chown root: /etc/.truenas_creds
sudo chmod 600 /etc/.truenas_creds

In your linux machine, create a folder to where you want the contents of the remote samba share to be mounts. For example: create a directory named /mnt/truenas/.

sudo mkdir /mnt/truenas/

-Below is a sample syntax that can be used for populating /etc/fstab.

//ip-of-nas-server/enter-remote-samba-share/location /enter-local-mount/location/here/ cifs credentials=/etc/.truenas_creds,iocharset=utf8,uid=enter_your_uid_here,gid=enter_your_gid_here,noperm 0 0

-Here is what that I added in /etc/fstab.

//192.168.1.12/mnt/truenas /mnt/truenas/ cifs credentials=/etc/.truenas_creds,iocharset=utf8,uid=1000,gid=1000,noperm 0 0

My TrueNAS server’s IP => 192.168.1.12

Remote samba share => /mnt/truenas

Local mount location => /mnt/truenas/

Credentials for samba share => /etc/.truenas_creds

-Once complete, run the following to mount all entries looking at /etc/fstab.

mount -a

-If there are no errors in the above command, check your local mount path to verify that the mount was successful.

ls -l /mnt/truenas/

References:

linuxize

Askubuntu

Update to the latest ESXI 6.7 patch version on an Intel NUC (offline update)

I recently bought an Intel NUC for my homelab (NUC7i5BNH with 64Gigs of RAM) which has been running ESXi for the past few months and I have been happy with its performance so far. Fear for the worst, I noticed a few minor UI issues in the build that I was running which had been really bugging me. For Example: When using the search bar in the HTML5 UI, it partially hides the last search result in the list which was super annoying.

Luckily, VMware fixed these issues in one of the newer 6.7 patch releases and this blog post details on how I updated ESXi 6.7 U3 to the latest patch release on my NUC. To be precise, the upgrade was from ESXi-6.7.0-20190802001-standard (Build 14320388) to ESXi-6.7.0-20200604001 (Build 16316930). PS: I am not using vCenter in my homelab.

Short Version:

1. Backup your VMs/ESXI configuration. Download the latest patch from VMware’s website (Link).
2. Upload the ESXI patch release to the server’s datastore.
3. SSH into the NUC and get the full location of uploaded patch in your datastore. Find the profiles bundled within the patch file.
4. Put the ESXI server in maintenance mode and start the update.
4. Once update is complete, reboot the NUC, disable maintenance mode and you are good to go.

[Disclaimer: Please review VMware’s best practices for performing an ESXI upgrade which also includes taking backup of your ESXI configuration + VMs. if you plan to upgrade for a production system, make sure all necessary backups are taken before attempting the procedure. My NUC which is the 5th gen, the update worked right of the box without any customization. If you are running the new 10th generation Intel NUC, then you may need have make some modification to the VIBs for the upgrade to work.]

Long Version:

Go to VMware’s patch page  and download the latest patch version for the ESXI release (Link).

In my case, I downloaded the latest patch which at the time of writing this post was ESXi670-202006001.zip.

Before the upgrade, my Intel NUC was running the below build:

[root@nuc:~] vmware -vl
VMware ESXi 6.7.0 build-14320388
VMware ESXi 6.7.0 Update 3

-To check the volumes in the datastore. I did upload my patch to the ssd datastore which is a symlink.

[root@nuc:~] ls /vmfs/volumes/ -l
total 1792
drwxr-xr-x    1 root     root             8 Jan  1  1970 317122ee-8c7e716b-adf9-8414e6a14676
drwxr-xr-x    1 root     root             8 Jan  1  1970 5e4867ab-521f3ade-c1f4-94c691adc828
drwxr-xr-t    1 root     root         86016 Jun 26 18:10 5e486a9d-f29d23c4-81b6-94c691adc828
drwxr-xr-x    1 root     root             8 Jan  1  1970 dafb9eea-924c7ebf-4eba-5b7ab8fcbb15
lrwxr-xr-x    1 root     root            35 Jun 26 18:16 ssd -> 5e486a9d-f29d23c4-81b6-94c691adc828

Verify the full path/location of the uploaded image.

[root@nuc:~] ls /vmfs/volumes/5e486a9d-f29d23c4-81b6-94c691adc828/ESXi670-202006001.zip
/vmfs/volumes/5e486a9d-f29d23c4-81b6-94c691adc828/ESXi670-202006001.zip

Using esxcli, find the profiles that are bundled with the offline installer. The profile name will be used later when performing the upgrade.

[root@nuc:~] esxcli software sources profile list -d /vmfs/volumes/5e486a9d-f29d23c4-81b6-94c691adc828/ESXi670-202006001.zip
Name                             Vendor        Acceptance Level  Creation Time        Modification Time
-------------------------------  ------------  ----------------  -------------------  -------------------
ESXi-6.7.0-20200604001-standard  VMware, Inc.  PartnerSupported  2020-06-04T02:21:11  2020-06-04T02:21:11
ESXi-6.7.0-20200604001-no-tools  VMware, Inc.  PartnerSupported  2020-06-04T02:21:11  2020-06-04T02:21:11
[root@nuc:~]

Place the ESXI host in maintenance mode before starting the upgrade.

[root@nuc:~] esxcli system maintenanceMode set -e true

Verify that ESXI is running in Maintenance mode.

[root@nuc:~] esxcli system maintenanceMode get
Enabled

The output “Enabled” means that the host is in maintenance mode.

To perform the patch upgrade, pass the path and the profile as well.

[root@nuc:~] esxcli software profile update -d /vmfs/volumes/5e486a9d-f29d23c4-81b6-94c691adc828/ESXi670-202006001.zip -p ESXi-6.7.0-20200604001-standard
Update Result
Message: The update completed successfully, but the system needs to be rebooted for the changes to be effective.
Reboot Required: true
VIBs Installed: VMW_bootbank_ixgben_1.7.1.16-2vmw.670.3.104.16075168, 
....
[root@nuc:~]

Once the update is complete, reboot the ESXI server.

[root@nuc:~] reboot

Once the host is back up, SSH into the ESXI host. The host will still be in maintenance mode which is expected.

[root@nuc:~] esxcli system maintenanceMode get
Enabled

Disable maintenance mode

[root@nuc:~] esxcli system maintenanceMode set -e false
[root@nuc:~] esxcli system maintenanceMode get
Disabled

Now, verify that the update completed and is running the new build.

[root@nuc:~] vmware -vl
VMware ESXi 6.7.0 build-16316930
VMware ESXi 6.7.0 Update 3
[root@nuc:~]

Well, Thats it folks!! Hope this helps.


PS: I anticipated the update process to be super confusing and tedious. However, it turned out to be fairly simple thanks to jeffreykusters and VMware’s instructions which I have credited them for below).

Credits/References/Sources:

jeffreykusters
Vmware

How to verify GPG key of a downloaded CentOS ISO and verify its checksum [Detailed]

This is a tutorial on how to check checksums of a CentOS image using GPG to verify the integrity of a downloaded CentOS ISO image.

1. Download the public key from the CentOS website

Open a terminal and create a directory where you need to download the ISO and the checksum file.

mkdir validate && cd validate/

Download the GPG public key from the official CentOS website. (You can find the full list of CentOS keys here. )

wget https://www.centos.org/keys/RPM-GPG-KEY-CentOS-Official

Below are the contents of the downloaded file which shows that this is a public key.

cat RPM-GPG-KEY-CentOS-Official
-----BEGIN PGP PUBLIC KEY BLOCK-----
Version: GnuPG v2.0.22 (GNU/Linux)

mQINBFzMWxkBEADHrskpBgN9OphmhRkc7P/YrsAGSvvl7kfu+e9KAaU6f5MeAVyn
rIoM43syyGkgFyWgjZM8/rur7EMPY2yt+2q/1ZfLVCRn9856JqTIq0XRpDUe4nKQ
8BlA7wDVZoSDxUZkSuTIyExbDf0cpw89Tcf62Mxmi8jh74vRlPy1PgjWL5494b3X
5fxDidH4bqPZyxTBqPrUFuo+EfUVEqiGF94Ppq6ZUvrBGOVo1V1+Ifm9CGEK597c
aevcGc1RFlgxIgN84UpuDjPR9/zSndwJ7XsXYvZ6HXcKGagRKsfYDWGPkA5cOL/e
f+yObOnC43yPUvpggQ4KaNJ6+SMTZOKikM8yciyBwLqwrjo8FlJgkv8Vfag/2UR7
JINbyqHHoLUhQ2m6HXSwK4YjtwidF9EUkaBZWrrskYR3IRZLXlWqeOi/+ezYOW0m
vufrkcvsh+TKlVVnuwmEPjJ8mwUSpsLdfPJo1DHsd8FS03SCKPaXFdD7ePfEjiYk
nHpQaKE01aWVSLUiygn7F7rYemGqV9Vt7tBw5pz0vqSC72a5E3zFzIIuHx6aANry
Gat3aqU3qtBXOrA/dPkX9cWE+UR5wo/A2UdKJZLlGhM2WRJ3ltmGT48V9CeS6N9Y
m4CKdzvg7EWjlTlFrd/8WJ2KoqOE9leDPeXRPncubJfJ6LLIHyG09h9kKQARAQAB
tDpDZW50T1MgKENlbnRPUyBPZmZpY2lhbCBTaWduaW5nIEtleSkgPHNlY3VyaXR5
QGNlbnRvcy5vcmc+iQI3BBMBAgAhBQJczFsZAhsDBgsJCAcDAgYVCAIJCgsDFgIB
Ah4BAheAAAoJEAW1VbOEg8ZdjOsP/2ygSxH9jqffOU9SKyJDlraL2gIutqZ3B8pl
Gy/Qnb9QD1EJVb4ZxOEhcY2W9VJfIpnf3yBuAto7zvKe/G1nxH4Bt6WTJQCkUjcs
N3qPWsx1VslsAEz7bXGiHym6Ay4xF28bQ9XYIokIQXd0T2rD3/lNGxNtORZ2bKjD
vOzYzvh2idUIY1DgGWJ11gtHFIA9CvHcW+SMPEhkcKZJAO51ayFBqTSSpiorVwTq
a0cB+cgmCQOI4/MY+kIvzoexfG7xhkUqe0wxmph9RQQxlTbNQDCdaxSgwbF2T+gw
byaDvkS4xtR6Soj7BKjKAmcnf5fn4C5Or0KLUqMzBtDMbfQQihn62iZJN6ZZ/4dg
q4HTqyVpyuzMXsFpJ9L/FqH2DJ4exGGpBv00ba/Zauy7GsqOc5PnNBsYaHCply0X
407DRx51t9YwYI/ttValuehq9+gRJpOTTKp6AjZn/a5Yt3h6jDgpNfM/EyLFIY9z
V6CXqQQ/8JRvaik/JsGCf+eeLZOw4koIjZGEAg04iuyNTjhx0e/QHEVcYAqNLhXG
rCTTbCn3NSUO9qxEXC+K/1m1kaXoCGA0UWlVGZ1JSifbbMx0yxq/brpEZPUYm+32
o8XfbocBWljFUJ+6aljTvZ3LQLKTSPW7TFO+GXycAOmCGhlXh2tlc6iTc41PACqy
yy+mHmSv
=kkH7
-----END PGP PUBLIC KEY BLOCK-----

2. Check and verify the fingerprint of the downloaded public key.

Using gpg, check the fingerprint of the downloaded public key file using the following command:

gpg --dry-run --import --import-options import-show  ./RPM-GPG-KEY-CentOS-Official
pub   rsa4096 2019-05-03 [SC]
      99DB70FAE1D7CE227FB6488205B555B38483C65D
uid                      CentOS (CentOS Official Signing Key) <[email protected]>

gpg: Total number processed: 1

From the output, the fingerprint is 99DB70FAE1D7CE227FB6488205B555B38483C65D.

Now, we need to verify if the fingerprint matches the one documented in official CentOS page.

So, go to https://www.centos.org/keys/ and search for the above fingerprint.


verify fingerprint matches from centos official keys documentation page

[Note: You could split the fingerprint into blocks of four characters as shown below: 99DB 70FA E1D7 CE22 7FB6 4882 05B5 55B3 8483 C65D ]

If the fingerprint matches the one documented in the official CentOS key documentation page, then the public key is untampered and can be trusted.

[Note: If you are using a newer version of gpg, then you can use “gpg –quiet –with-fingerprint ./RPM-GPG-KEY-CentOS-Official“. I did not use the –with-fingerprint flag as the version of gpg installed in my machine does not show the fingerprints with the –with-fingerprint flag.]

3. Import the Public key to your GNUPG keyring

Now, import the downloaded key to your gnupg keyring.

gpg --import ./RPM-GPG-KEY-CentOS-Official
gpg: key 05B555B38483C65D: public key "CentOS (CentOS Official Signing Key) <[email protected]>" imported
gpg: Total number processed: 1
gpg:               imported: 1

The above shows that it processed and imported 1 key to you local store.

To list the keys currently in your gnupng keyring, you can use the following:

gpg --list-keys
/home/r3con/.gnupg/pubring.kbx
------------------------------
pub rsa4096 2019-05-03 [SC]
99DB70FAE1D7CE227FB6488205B555B38483C65D
uid [ unknown] CentOS (CentOS Official Signing Key) <[email protected]

4. Download the CentOS ISO image

Download the CentOS ISO file:

wget http://mirrors.piconets.webwerks.in/centos-mirror/8.1.1911/isos/x86_64/CentOS-8.1.1911-x86_64-dvd1.iso

5. Download the CHECKSUM.asc file and verify that it is not tampered with.

Once the download is complete, download the “CHECKSUM.asc” file from the CentOS website:

wget http://mirror.centos.org/centos/8/isos/x86_64/CHECKSUM.asc

If you read the contents of the CHECKSUMS.asc file, you will see that it contains a PGP signed message with the checksums for the CentOS ISO image.

cat CHECKSUM.asc
-----BEGIN PGP SIGNED MESSAGE-----
Hash: SHA256

# CentOS-8.1.1911-x86_64-boot.iso: 625999872 bytes
SHA256 (CentOS-8.1.1911-x86_64-boot.iso) = 7fea13202bf2f26989df4175aace8fdc16e1137f7961c33512cbfad844008948
# CentOS-8.1.1911-x86_64-dvd1.iso: 7554990080 bytes
SHA256 (CentOS-8.1.1911-x86_64-dvd1.iso) = 3ee3f4ea1538e026fff763e2b284a6f20b259d91d1ad5688f5783a67d279423b
-----BEGIN PGP SIGNATURE-----
Version: GnuPG v1

iQIVAwUBXh3OvAW1VbOEg8ZdAQihSxAArC0gfNTr0bWPOT/k40lTSoxgDF0qGn4+
d5j9noV3c0Xqd4Um/hxs7ha/qTg82DISYC8+5XHRvU3k156Mxh7dy4FoPopwItoc
lpMjnXwDYC/Iptp1XHiD2sun+z+omC2B+DcZergDwrrJzb7CZzxGr84Ztl6Wd54s
jCI3dQEsakQUEEuekr3mHtB1R4QHHaRwVwUJSzRQYLF3XiCq788IUaI2sf5kHXsg
BxWhzHsBCPG4/FC0ev9ujp5OP/j2FZq4S0cp1+53t/BauyGPOdbvQw71xKsHZQ3J
G9TNaFzlAqZJDKpz+XgjQ1V/7kKaFY3dCbxITxbOdSGAMh25cbWd2AamnCFuTzIq
vpWY8xWgx6kQ8aLI+VekOYYl4zZswmJBBogXDURCJTqRY6efkT8qhuWVS/obWjBL
L3uLL6w4ZkkatUZwglcj2+BhXefAGZgfBExI/xUHFzyXdB8Jv/YwYTTEsREZhf+T
8ggDOOznlUvrNz/atYKwNqAWbC2oY5UXL2OhDznm3lXwQPJG9vZ2Hx6UFpEuuBOR
m407o8rfosEbnHgxh9qQ2gnlk+m30VZqhr2dQnOibdY7YtHqk++5snr+yDmXKWDU
r08BLy0qGdI8CDxOS0DDb5MmIa5xc2c3w0Jt5q+H9tD7VAlg5uJBju0GwXSsiWHf
PlXTxMDETyY=
=TBYO
-----END PGP SIGNATURE-----

To verify that downloaded “CHECSUMS.asc” file is not tampered and is indeed from CentOS, use the –verify flag.

gpg --verify CHECKSUM.asc
gpg: Signature made Tue Jan 14 19:52:52 2020 IST
gpg: using RSA key 05B555B38483C65D
gpg: Good signature from "CentOS (CentOS Official Signing Key) <[email protected]>" [unknown]
gpg: WARNING: This key is not certified with a trusted signature!
gpg: There is no indication that the signature belongs to the owner.
Primary key fingerprint: 99DB 70FA E1D7 CE22 7FB6 4882 05B5 55B3 8483 C65D

The above outputs shows the the signature is good and CHECSUM.asc file is good and not tampered.

At this point, you should have the following files in the directory:

ls -l
total 7377932
-rwxrwxrwx 1 r3con r3con 1179 Jun 3 11:10 CHECKSUM.asc
-rwxrwxrwx 1 r3con r3con 7554990080 Jan 4 03:17 CentOS-8.1.1911-x86_64-dvd1.iso
-rwxrwxrwx 1 r3con r3con 1683 Sep 12 2019 RPM-GPG-KEY-CentOS-Official

6. Verifying the checksum of the downloaded image using the CHECKSUM.asc file.

To verify the checksums of the downloaded ISO image using the following command:

sha256sum -c CHECKSUM.asc 2>&1 | grep OK
CentOS-8.1.1911-x86_64-dvd1.iso: OK

succesfull sha256 checksum verification

This shows that the checksum matches and the downloaded ISO file is intact or not tampered with.

Hope this helps. Cheers

Source/Credits/References:

CentOS Documentation

GNUPG Fingerprint workaround

Bash script to loop through values in a file with space as a separator

Lets say we have a file with list of IPs that are space separated and you want to read each of the values to pass to a loop to perform an operation. Here is an example file with IP Addresses separated  by a space:

cat ips.txt
192.168.1.1 192.168.1.10

Now, lets say you want to loop through these IPs and run a ping command against each of them.

cat ping.sh
#!/bin/bash

# IFS is an internal bash variable. Here, we set its value as space.
IFS=$" "
# Read the file "ips.txt" and store the list of values to a variable "ips"
ips="$(cat ips.txt)"

# Run the following loop which will loop through each of the ips and run a ping test
for ip in $ips; do ping -c 1 $ip; done
# Unset the IFS variable so that it wont mess with the reset of the script
unset IFS

-Running this loop, will loop through the list of IP addresses and perform a ping.

./ping.sh
PING 192.168.1.1 (192.168.1.1) 56(84) bytes of data.
64 bytes from 192.168.1.1: icmp_seq=1 ttl=64 time=0.660 ms

--- 192.168.1.1 ping statistics ---
1 packets transmitted, 1 received, 0% packet loss, time 0ms
rtt min/avg/max/mdev = 0.660/0.660/0.660/0.000 ms
PING 192.168.1.10 (192.168.1.10) 56(84) bytes of data.
64 bytes from 192.168.1.10: icmp_seq=1 ttl=64 time=0.108 ms

--- 192.168.1.10 ping statistics ---
1 packets transmitted, 1 received, 0% packet loss, time 0ms
rtt min/avg/max/mdev = 0.108/0.108/0.108/0.000 ms

Hope this helps!

Happy scripting folks! 🙂

Source/References: Link

Monitor a Linux host with Telgraf InfluxDB and Chronograf using Docker

This is a guide on how to monitor a Linux device(s) using Telgraf, InfluxDB and Chronograph. To make things easier, we will be running all these components using Docker.

Requirements:

  • Docker should be installed  [Note: Docker version 19.03.08 was used in this tutorial]
  • Internet connectivity to pull the docker images
  • Custom docker network
  • Sufficient Disk space to store data in InfluxDB

1. Create a custom docker network:

-Lets create a custom docker bridge network. Below, I have created a custom docker network with the name “influxdb”.

docker network create influxdb

You can name it whatever you want. You just need to make sure that name is passed in the –net flag in other docker commands.

You can verify that the network is created using the following command:

docker network ls

-Below are the sample outputs:

extr3me@op3n:~$ docker network ls
NETWORK ID NAME DRIVER SCOPE
0d72e4098315 bridge bridge local
e3808d2b4078 host host local
d2c5b3842508 influxdb bridge local
a25ec7e0c8a2 none null local


2. Run InfluxDB:

-InfluxDB is database where all the statistics of the host will be stored. To create an instance of InfluxDB, run the following command pass the network name as well as shown below:

docker run -d --name=influxdb --net=influxdb influxdb

3. Run Telegraf:

-Before you run Telegraf, you would need to create Telegraf config file. Run the below commands to generate a sample Telegraf configuration file.

mkdir telegraf
docker run --rm telegraf telegraf config > telegraf/telegraf.conf
ls telegraf/

-Modify the above telegraf.conf as per your requirement. For starters, you can un-comment the outputs.influx block and the urls section. So, the config file would have the following:

[[outputs.influxdb]]
   urls = ["http://influxdb:8086"]

-The above output block tells Telegraf where the Influxdb database is located.  Once this configuration file is passed to telegraph in the next section, then Telegraf will interact with InfluxDB (read and write data) via API.

-Now that we have the configuration file ready, we can run Telegraf and pass the configuration file.

-Below I am passing /sys /proc and /etc as readonly mounts inside the container. Optionally, I have passed the docker socket as well as a bind mount so that I can monitor the resource usage of docker and the running containers too.

docker run -d --restart=always --name telegraf \
--net=influxdb --hostname=telegraf \
-e "HOST_PROC=/rootfs/proc" \
-e "HOST_SYS=/rootfs/sys" \
-e "HOST_ETC=/rootfs/etc" \
-v $(pwd)/telegraf/telegraf.conf:/etc/telegraf/telegraf.conf:ro \
-v /var/run/docker.sock:/var/run/docker.sock:ro \
-v /sys:/rootfs/sys:ro \
-v /proc:/rootfs/proc:ro \
-v /etc:/rootfs/etc:ro \
telegraf

You can add/modify the source as you wish to monitor more data. You just need to make sure that the the necessary mounts/variables are passed as well.

4. Run Chronograf:

-Chronograf is used to visualize the data using a browser. It can talk to InfluxDB and display the data in forms of graphs etc.

-To run Chronograf, you can run the following docker command:

docker run -d --name chronograf -p 8888:8888 --net=influxdb chronograf --influxdb-url=http://influxdb:8086

-Verify all containers are running using “docker ps -a

extr3me@op3n:~$ docker ps -a
CONTAINER ID        IMAGE               COMMAND                  CREATED             STATUS              PORTS                          NAMES
a9da408e41b0        chronograf          "/entrypoint.sh --in_"   39 seconds ago      Up 38 seconds       0.0.0.0:8888->8888/tcp         chronograf
326255e6d234        telegraf            "/entrypoint.sh tele_"   36 minutes ago      Up 36 minutes       8092/udp, 8125/udp, 8094/tcp   telegraf
51c95679a803        influxdb            "/entrypoint.sh infl_"   About an hour ago   Up About an hour    8086/tcp                       influxdb

The above output shows that all the three containers are up and running.

-Now, you can access the Chronograf Dashboard from your browser by visiting the following URL.

http://localhost:8888

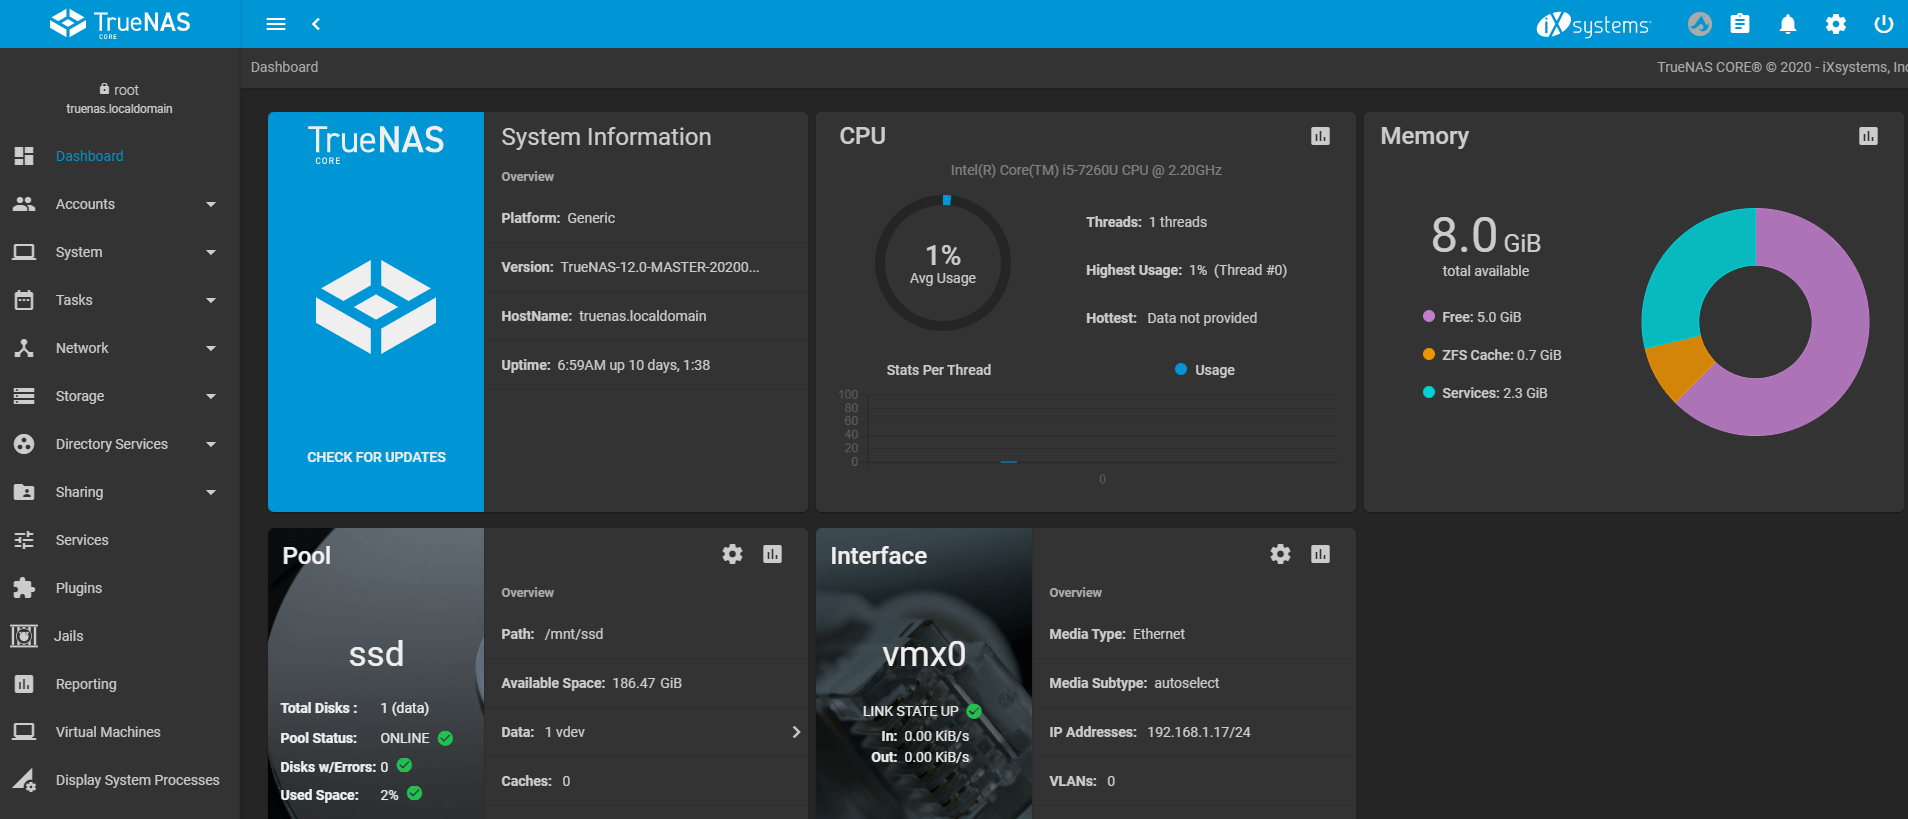
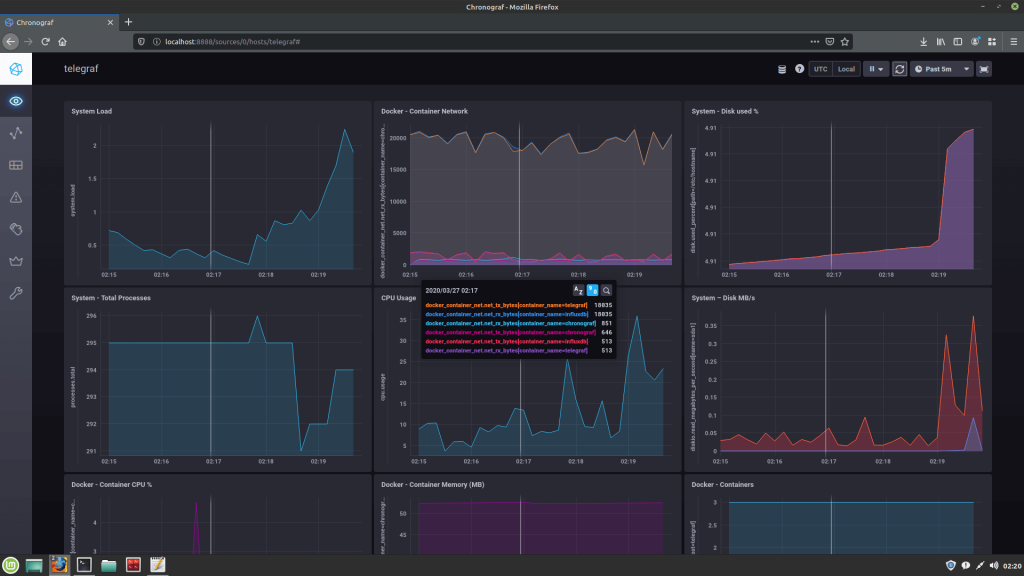
Once you are in the Chronograf UI, you can   navigate to “Host Lists” and click on host to view the collected stats.

Below is a screenshot of Chronograf that is displays the host information:

chronograf graphs


Troubleshooting:

To troubleshoot API issues, you could create a sample container in same  “influxdb” network and install curl in it.

For example: You could create an alpine container attached to the influxdb network.

docker run --net=influxdb -it alpine sh

Then install curl using “apk add curl”. Below is the sample outputs:

/ # apk add curl
fetch http://dl-cdn.alpinelinux.org/alpine/v3.11/main/x86_64/APKINDEX.tar.gz
fetch http://dl-cdn.alpinelinux.org/alpine/v3.11/community/x86_64/APKINDEX.tar.gz
(1/4) Installing ca-certificates (20191127-r1)
(2/4) Installing nghttp2-libs (1.40.0-r0)
(3/4) Installing libcurl (7.67.0-r0)
(4/4) Installing curl (7.67.0-r0)
Executing busybox-1.31.1-r9.trigger
Executing ca-certificates-20191127-r1.trigger
OK: 7 MiB in 18 packages

-Once curl is installed, Then try the following sample InfluxDB API calls pointing to the InfluxDB endpoint from within the Alpine container:

curl -i -XPOST http://influxdb:8086/query --data-urlencode "q=show databases"

-Below are sample outputs:

/ # curl -i -XPOST http://influxdb:8086/query --data-urlencode "q=show databases"
HTTP/1.1 200 OK
Content-Type: application/json
Request-Id: e58a61db-6fa6-11ea-85a3-0242ac120002
X-Influxdb-Build: OSS
X-Influxdb-Version: 1.7.10
X-Request-Id: e58a61db-6fa6-11ea-85a3-0242ac120002
Date: Thu, 26 Mar 2020 21:15:19 GMT
Transfer-Encoding: chunked

{"results":[{"statement_id":0,"series":[{"name":"databases","columns":["name"],"values":[["_internal"],["telegraf"]]}]}]}

-Here is another example on how to to check if you are able to create a database:

curl -i -XPOST http://influxdb:8086/query --data-urlencode "q=CREATE DATABASE telegraf"

To troubleshoot issues related to Telegraf, you review the docker logs.

docker logs -f telegraf

To troubleshoot issues with InfluxDB, you can manually access InfluxDB’s shell/CLI and run commands (just like you would in other database servers such as MySQL.)

Below is an example on how to view the list of databases from InfluxDB shell.

docker exec -it influx sh
# influx
Connected to http://localhost:8086 version 1.7.10
InfluxDB shell version: 1.7.10
> show databases
name: databases
name
----
_internal
telegraf

I hope this helps. Do share, leave a like/comment below! Cheers!


Regards,

ΞXΤЯ3МΞ


Sources/References:

https://hub.docker.com/_/telegraf/
https://hub.docker.com/_/chronograf/
https://www.jacobtomlinson.co.uk/monitoring/2016/06/23/running-telegraf-inside-a-container/

Update CA certificate store in Fedora to trust a root CA certificate

Lets assume you have a CA certificate “ca.crt” that you want your system or utilities like curl to trust then you can do the following:

Copy the CA certificate to /etc/pki/ca-trust/source/anchors/

sudo cp ca.crt /etc/pki/ca-trust/source/anchors/

Then you can run the following command to update Fedora’s local CA store.

sudo update-ca-trust

Now you system and tools like curl will trust certificates signed by this CA.

Verify that SSL connection is trusted using curl :

Lets say you have a webserver server whose certificate was signed by the above root CA and the signed certificate is already uploaded to the webserver. You can verify that your Fedora client trusts the certificate using curl.

curl -vvv https://test-server-fqdn.com

In the above curl command, I am passing the verbose flag -vvv which is optional. It is handy for troubleshooting purposes SSL issues.

If the connection is trusted, the SSL connection should work and you would see a message such as below from the curl outputs:

* server certificate verification OK

Note: This was tested on Fedora 31.

Source/References:

https://serverfault.com/questions/394815/how-to-update-curl-ca-bundle-on-redhat
https://www.linux.org/docs/man8/update-ca-trust.html

Run bash script from a Perl script

To run a bash script (Example: bash-script.sh) from inside a perl script, you could use the following syntax:

system("sh", "bash-script.sh")

Note: Here, once the bash script completes execution it will continue with the execution of the perl script.

Example:

Perl Script: perl-script.pl
Bash Script: bash-script.sh

Below is a perl script  “perl-script.pl” which calls an external bash script “bash-script.sh”.

#!/usr/bin/perl
use strict;
use warnings;

print "Running parent perl script. \n";
print "Starting to call external bash script\n";

# Sample Argument to be passed to the bash script
my $my_arg = "ARG1";

# With arguments - pass them inside quotes seperated by commas 
system("sh", "bash-script.sh","$my_arg");

print "Back to parent perl script\n";

Below is the sample “bash-script.sh” which prints the variable.

#!/bin/bash
echo "---Start of Bash script---"

a=$1
echo "Argument from Perl script is" $a

To test, execute the perl script:

./perl-script.pl


Credits/References
https://stackoverflow.com/questions/3200801/how-can-i-call-a-shell-command-in-my-perl-script

How to fix print_req_error: I/O error, dev fd0, sector 0 error

After a fresh install of Ubuntu, my terminal was being flooded with “print_req_error: I/O error, dev fd0, sector 0” error.

dev fd0

This is because, your kernel thinks you have a floppy disk fd0, but cant find one. To fix this issue, you can run the following in your terminal:

sudo rmmod floppy
echo "blacklist floppy" | sudo tee /etc/modprobe.d/blacklist-floppy.conf
sudo dpkg-reconfigure initramfs-tools

EDIT: Thanks @Joanmi for your comment (For the noticing the issue with sudo command.) 

Misc: If you are deploying a new virtual machine, you can avoid this issue by deleting the Floppy Disk drive.

Source: StackOverflow