This is a beginner level tutorial on learning basics of debugging using GDB by debugging an executable. This post will cover writing a very simple C code, compiling it and then opening the generated executable in GDB for inspecting the working/debugging. The primary objective here is to get familiar with the basics of using GDB.
Requirements:
- Any Linux x64 OS. (Linux Mint 20 used in this tutorial)
- C compiler – gcc
- gdb – for debugging / reverse engineering.
- GDB Dashboard (Optional – Makes GDB easier to read)
[Disclaimer: This is blog post adapted from recurse’s original gdb tutorial.(All Credits/References added in the Credits section)]
Setting up the Environment:
- Install the following tools to setup the basic environment:
sudo apt install vim gcc gdb git python3 python3-pip -y
GDB Dashboard:
- To make GDB easier to understand and make it non-alien, use GDB Dashboard which is a really good python plugin for GDB. Its epic!
- Run the following to get the gdbinit dotfile.
wget -P ~ https://git.io/.gdbinitIf you would like to check out the source, you can find it @ https://github.com/cyrus-and/gdb-dashboard
For syntax highlighting, you would need the pygments module. If you are using Python2.x:
pip install pygments
If you are using Python3.x, then use pip3 to install it:
pip3 install pygments
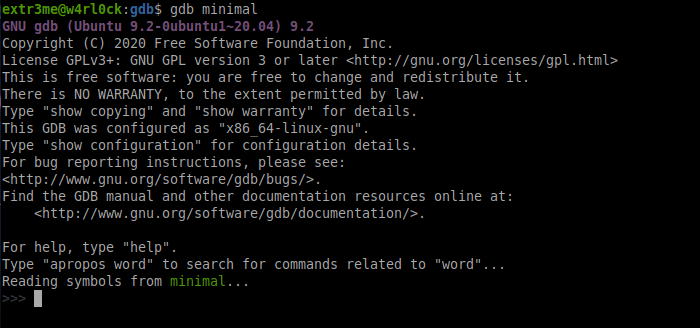
To run gdb without providing any executable, run “gdb” and you should see the something like below:
extr3me@w4rl0ck:gdb$ gdb
GNU gdb (Ubuntu 9.2-0ubuntu1~20.04) 9.2
Copyright (C) 2020 Free Software Foundation, Inc.
License GPLv3+: GNU GPL version 3 or later <http://gnu.org/licenses/gpl.html>
This is free software: you are free to change and redistribute it.
There is NO WARRANTY, to the extent permitted by law.
Type "show copying" and "show warranty" for details.
This GDB was configured as "x86_64-linux-gnu".
Type "show configuration" for configuration details.
For bug reporting instructions, please see:
<http://www.gnu.org/software/gdb/bugs/>.
Find the GDB manual and other documentation resources online at:
    <http://www.gnu.org/software/gdb/documentation/>.

For help, type "help".
Type "apropos word" to search for commands related to "word".
>>>
To exit out of gdb, type “quit” .
-Below is a simple C program that initializes an integer value and then returns 0.
cat minimal.c
int main()
{
int i = 1337;
return 0;
}
-Compile the C code and make an executable, using the following flags:
gcc -g minimal.c -o minimal-The directory should now have a executable with filename minimal.
extr3me@w4rl0ck:gdb$ file minimal
minimal: ELF 64-bit LSB shared object, x86-64, version 1 (SYSV), dynamically linked, interpreter /lib64/ld-linux-x86-64.so.2, BuildID[sha1]=c918c072d119be6a9d18991e812a5414ecae67e1, for GNU/Linux 3.2.0, with debug_info, not stripped
Debugging the binary using GDB:
-To examine an executable in GDB, use the following format:
gdb <executable_file>-Here, I would run the following to open the executable for debugging:
gdb minimal
Lets check the functions in this program, to do run “info functions”. You should be able to see that this executable has function main().
>>> info functions
All defined functions:

File minimal.c:
1: int main();

Non-debugging symbols:
0x0000000000001000 _init
0x0000000000001030 __cxa_finalize@plt
0x0000000000001040 _start
0x0000000000001070 deregister_tm_clones
0x00000000000010a0 register_tm_clones
0x00000000000010e0 __do_global_dtors_aux
0x0000000000001120 frame_dummy
0x0000000000001140 __libc_csu_init
0x00000000000011b0 __libc_csu_fini
0x00000000000011b8 _fini
Here is a screenshot:
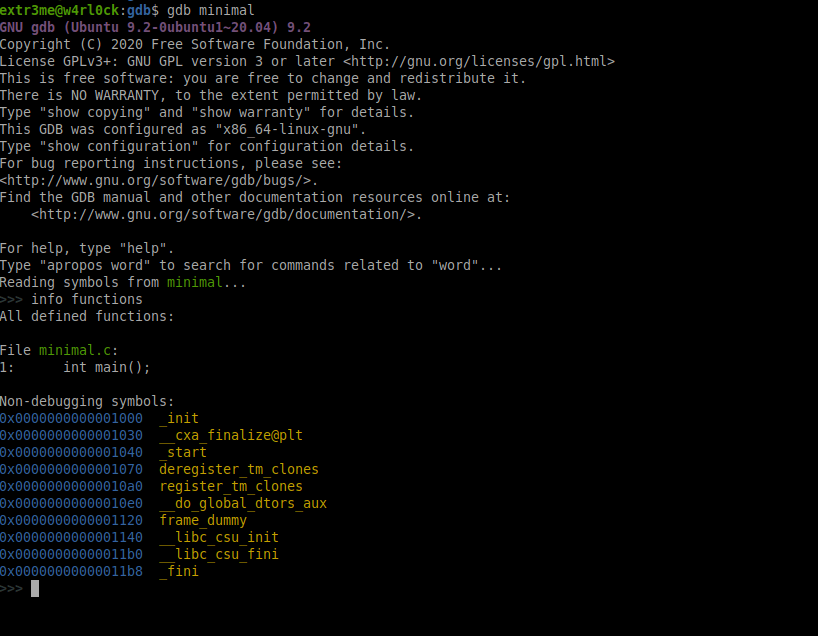
The output also shows that the line number at which main() function is present in the source minimal.c.
From the info functions output, we can also see that function main() is present at line number 1 in source minimal.c.
Breakpoints:
-Lets say we need to examine what a executable is going at a given point of time or to inspect the value of a variable, then we can set one or more breakpoints and run the code upto that breakpoint. You can then examine the the value of a variable upto that breakpoint or directly examine the memory etc.
Breakpoints example: Setting breakpoints using function name
From the previous section,we know that the executable has function main(). Lets start examining the binary using gdb to see the value of “i” at different stages of the execution. To start with, set a breakpoint at function main using the syntax break <function_name>:
>>> break main
Breakpoint 1 at 0x1129: file minimal.c, line 2.
>>>
To get the list of breakpoints that were set, you can use “info breakpoints”.
>>> info breakpoints
Num Type Disp Enb Address What
1 breakpoint keep y 0x0000000000001129 in main at minimal.c:2
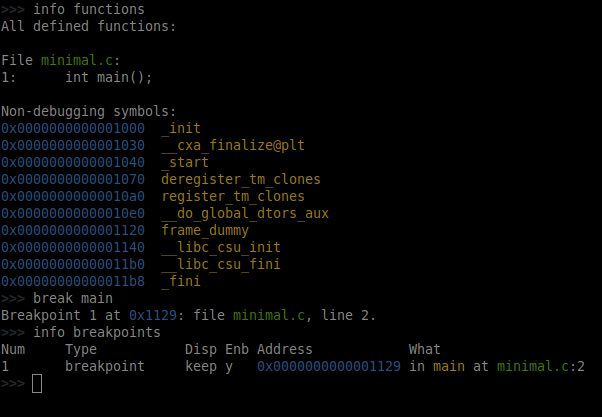
The above shows that there is one breakpoint which is set at function main() whose starting address in memory is “0x1129” or “0x0000000000001129“.
Note: You can have create multiple breakpoints and they are numbered.
So we have a breakpoint in place, we can run the binary upto the breakpoint that was set. To run the program, use “run” or “r“.
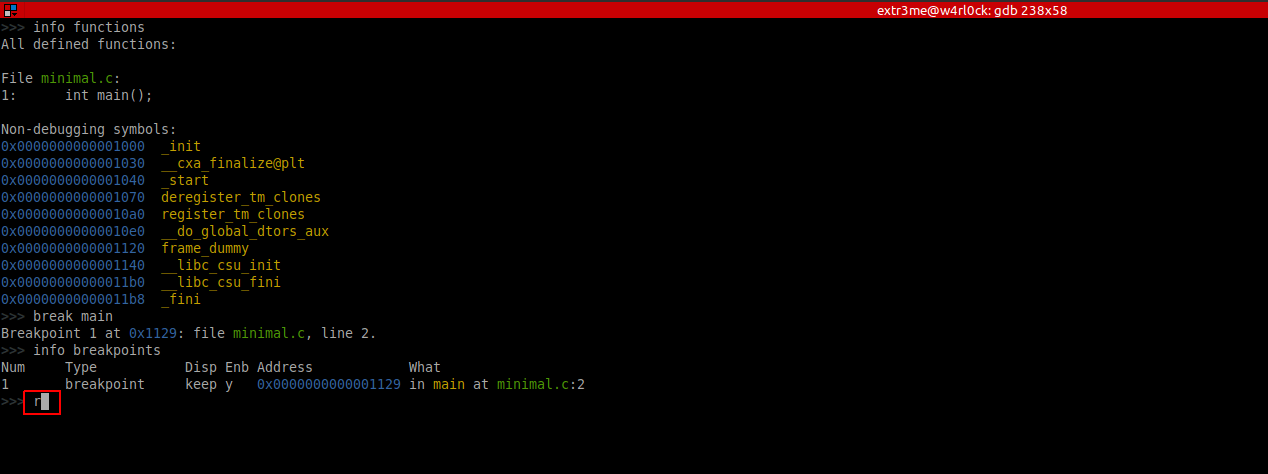
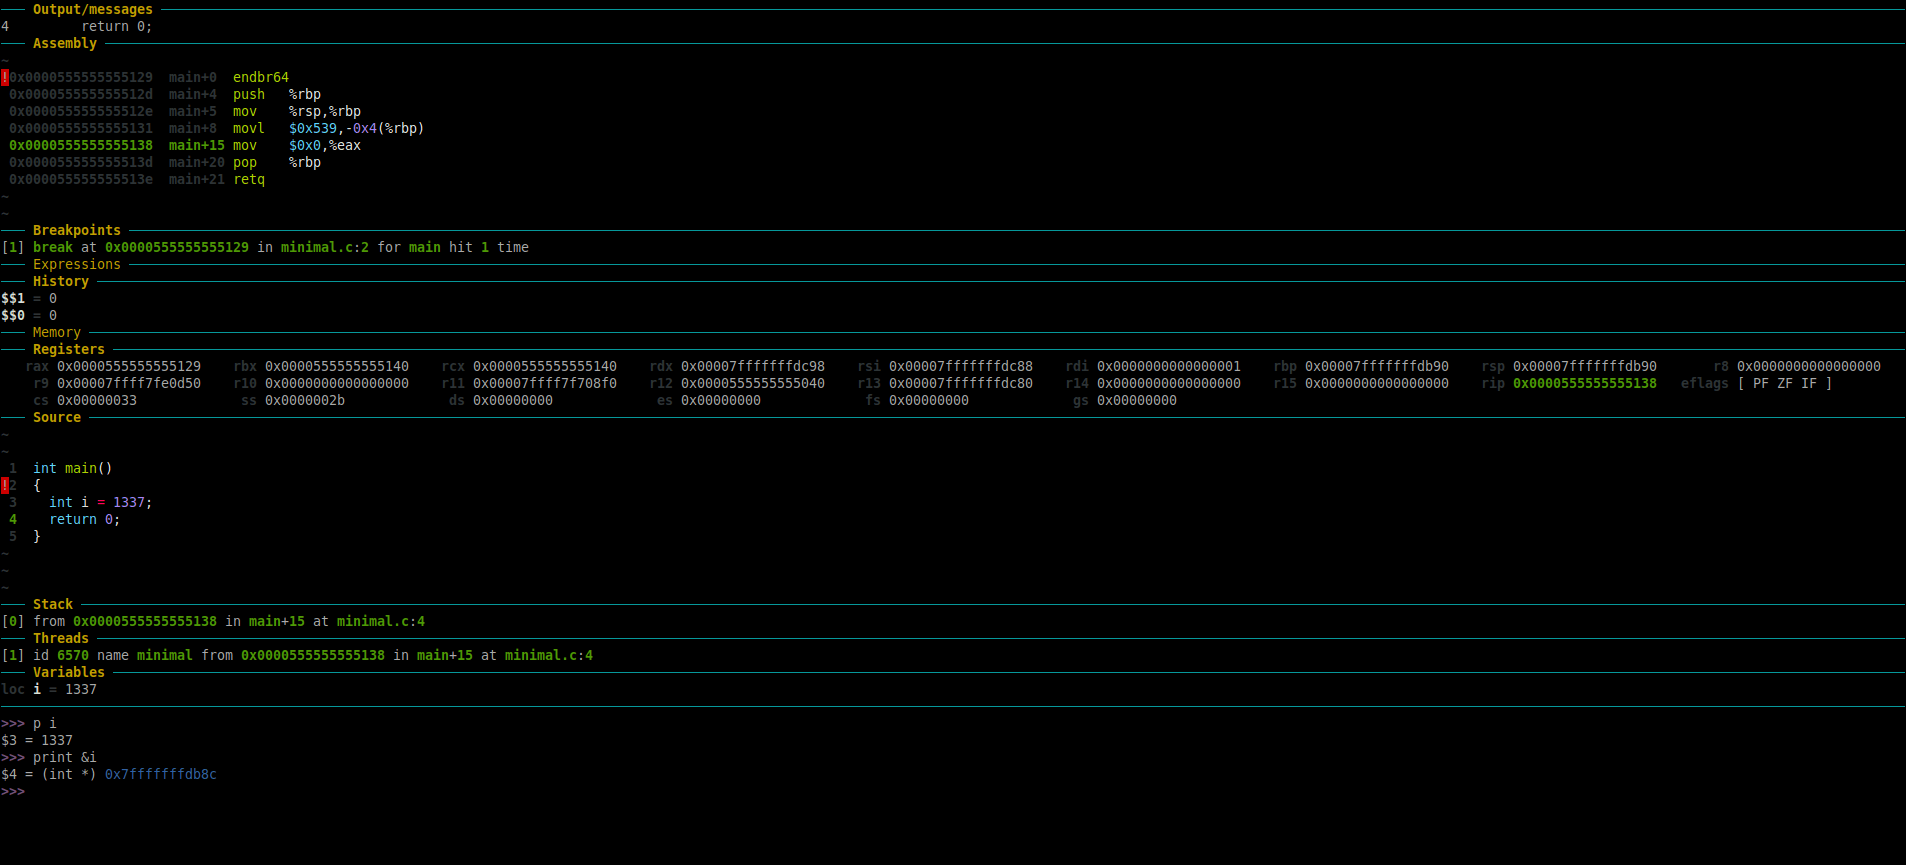
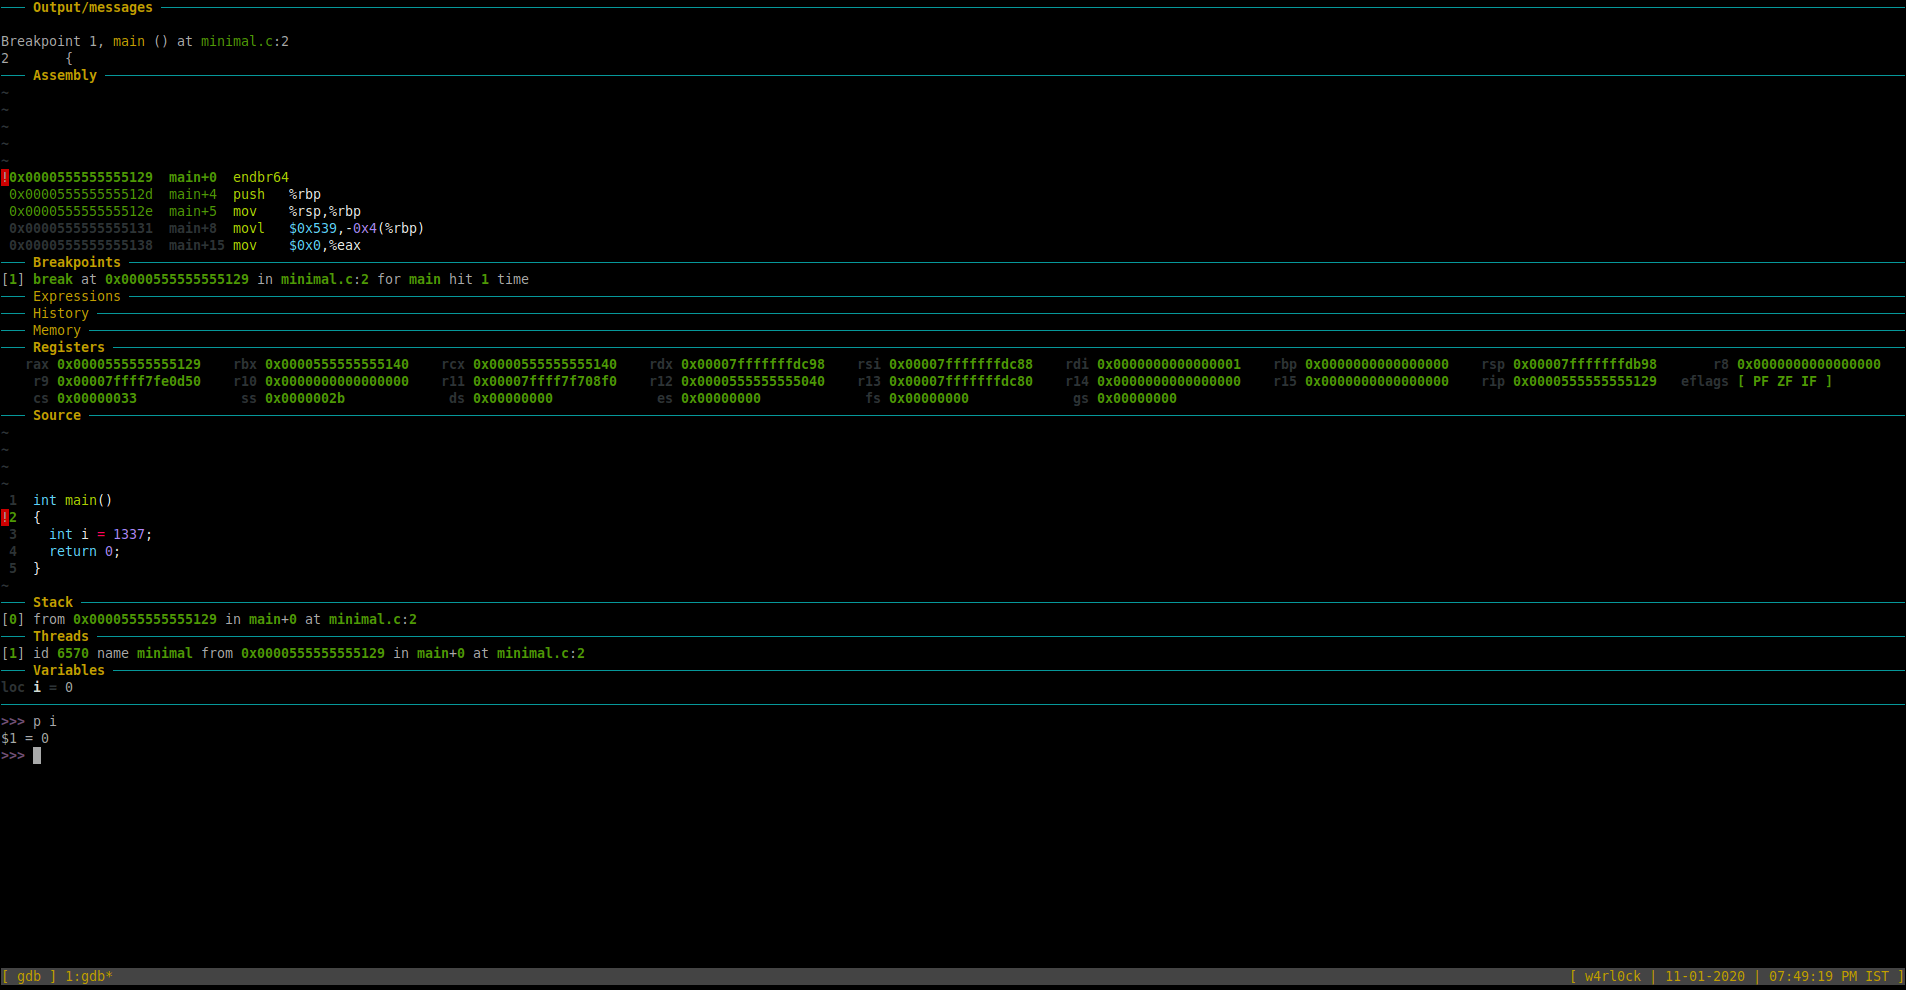
This is what it looks like now. (You could now see the GDB dashboard with an insane amount of matrix looking stuff. :P)
[Note: Right click the image and click on “View Image” / “Open image in new tab” if the image for better visibility. ]
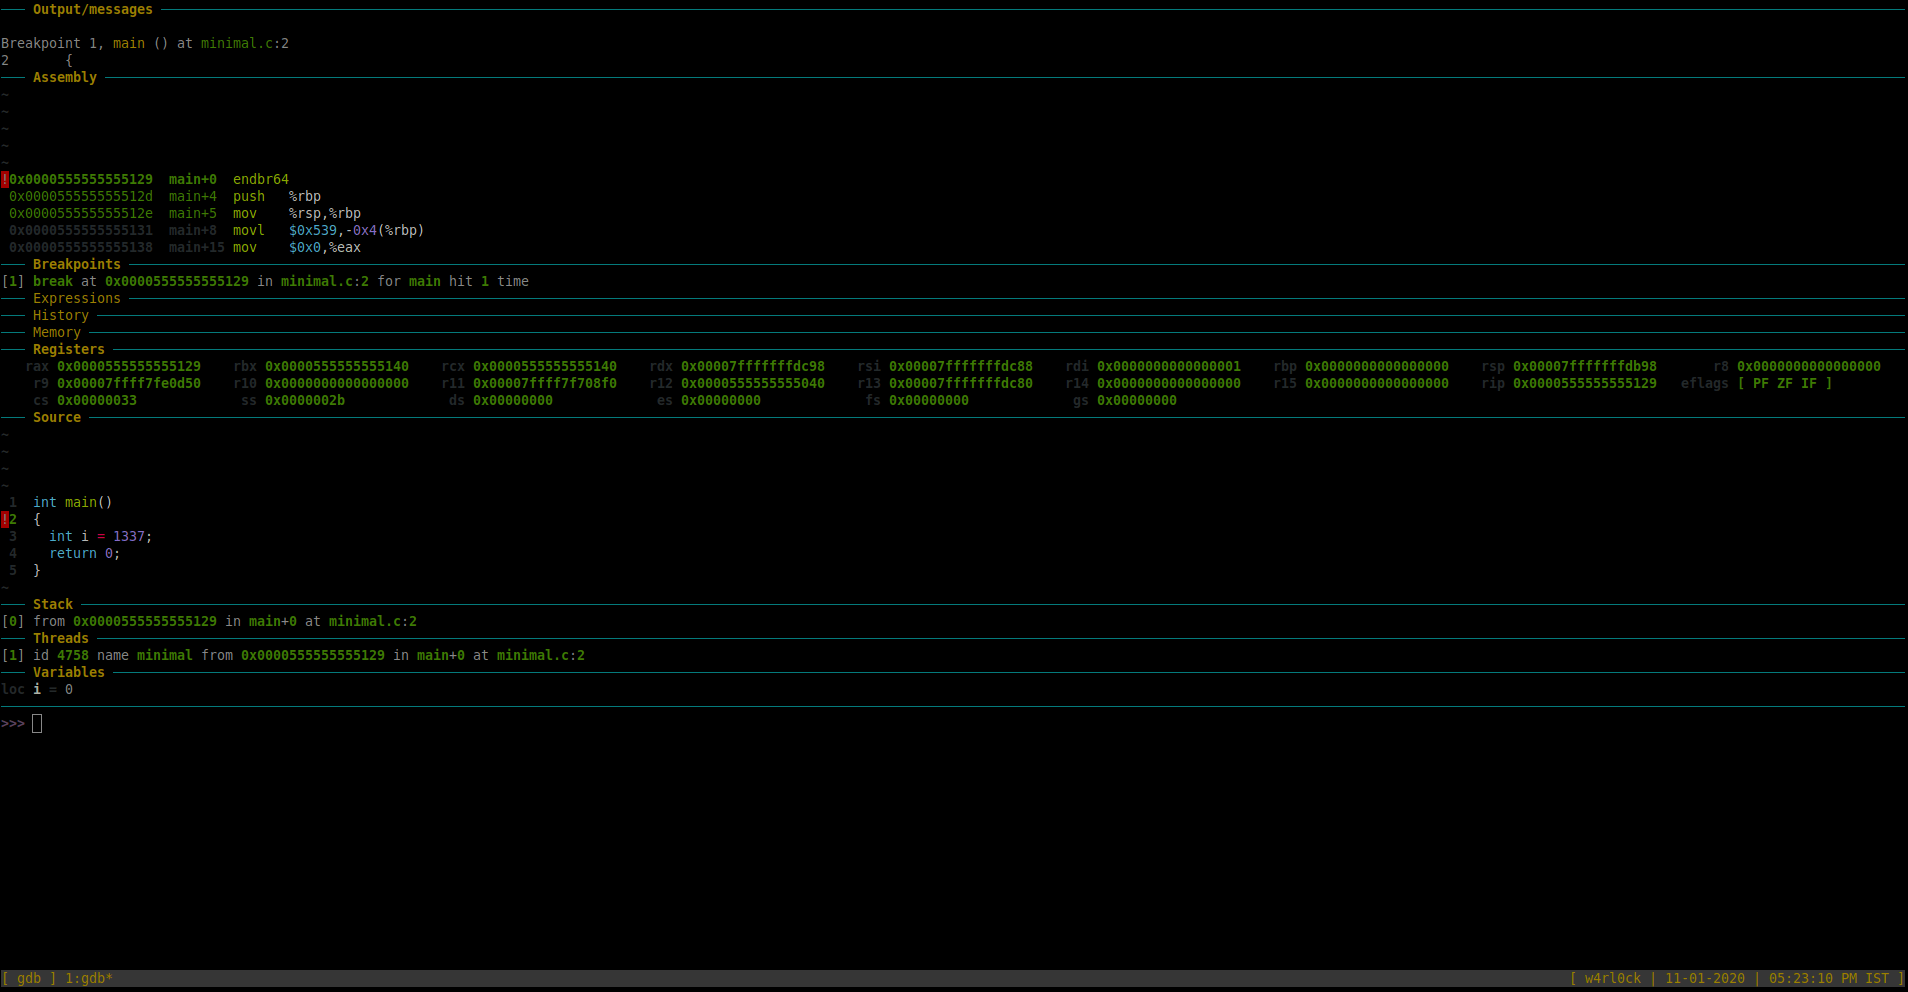
For this tutorial, we are more interested in few sections of Dashboard as of now – “Source” , “Threads”, “Variables” and “Assembly” sections.
-The “Source” section has a blip on the line number which shows where exactly in the code where gdb is looking into. So, here, it shows that its in line 2 of the source. After you ran the program, if you re-run “info breakpoints” you can see that the message “breakpoint already hit 1 time“.
>> info breakpoints
Num Type Disp Enb Address What
1 breakpoint keep y 0x0000555555555129 in main at minimal.c:2
breakpoint already hit 1 time
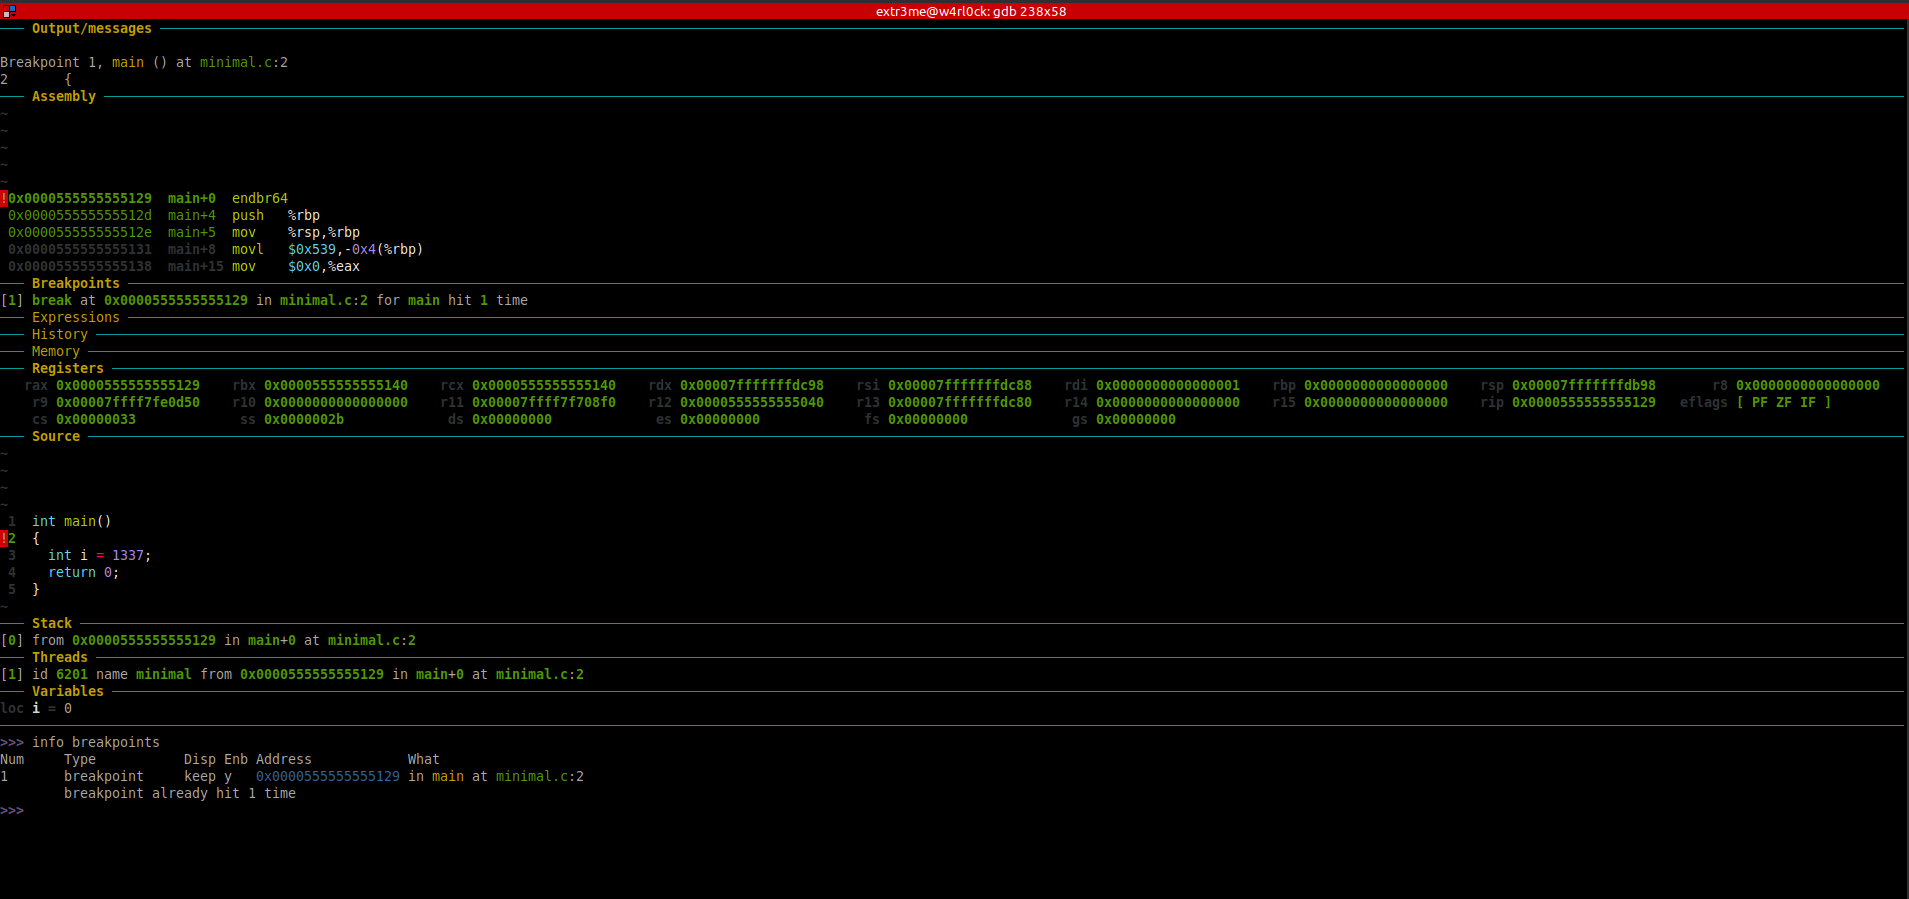
[Note: Right click the image and click on “View Image” / “Open image in new tab” if the image for better visibility. ]
As of now, the debugger is in line 2 where the variable “i” is not yet yet initiated in the program. So, if you try to print the value of “i”, then it should show a value = 0.
To print value of a variable, use the format “print var” or “p var“.
>> p i
$1 = 0
To go to the next line of code and execute it, use command “next” or “n“. [Note: If the next line of code was a function, it would execute the full function). In this example, once we ran “r“, the “Source” section now highlights line number 3.
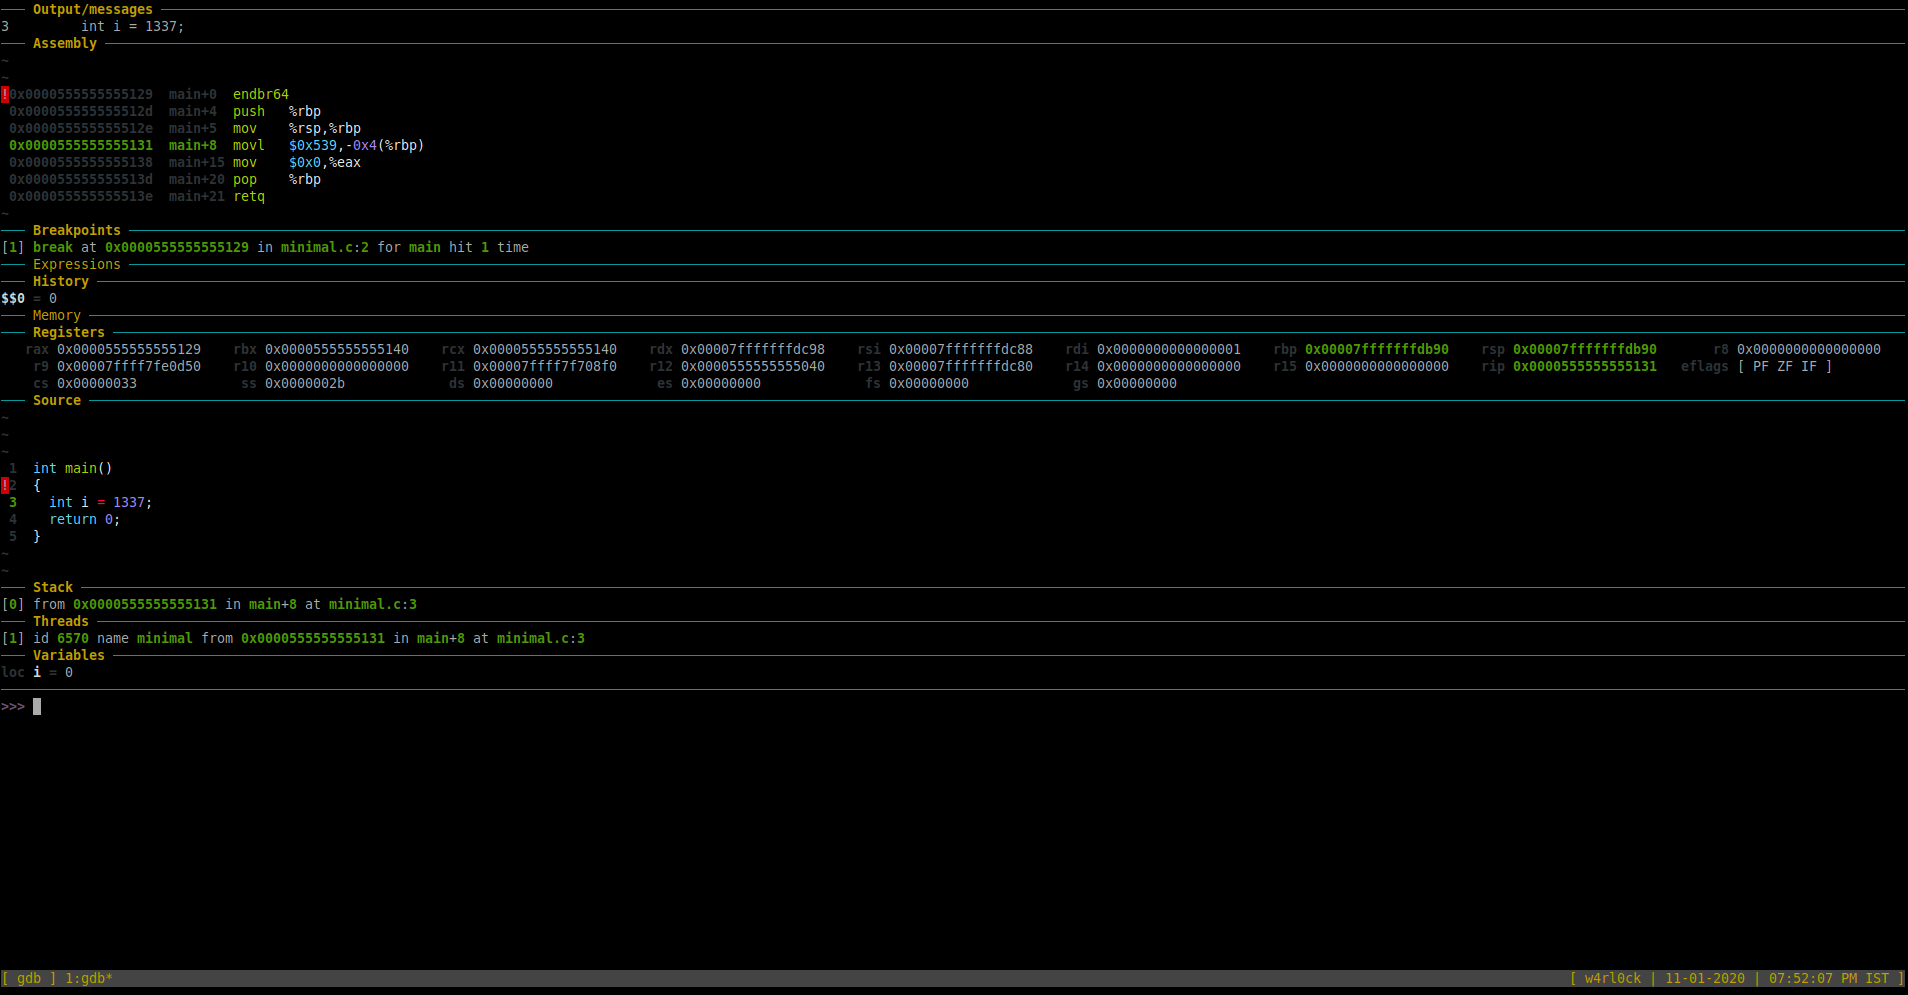
At this point, if you print variable “i”, it still shows value as “0” as the initialization is not complete.
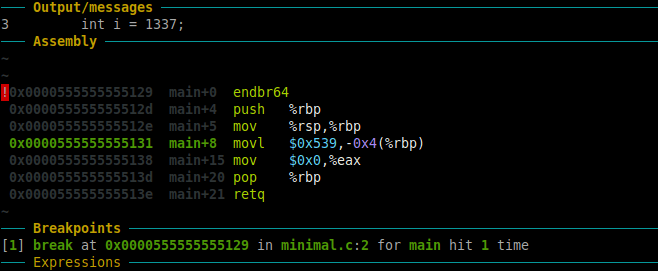
You can also check the “Assembly” section in the GDB Dashboard which shows the disassembled code. So, the highlighted section in green in the “Assembly” shows the following:
0x0000555555555131 main+8 movl $0x539,-0x4(%rbp)
This is the disassembled code (in AT&T syntax) for “int i = 1337”. We will come back to reviewing the assembly code later.
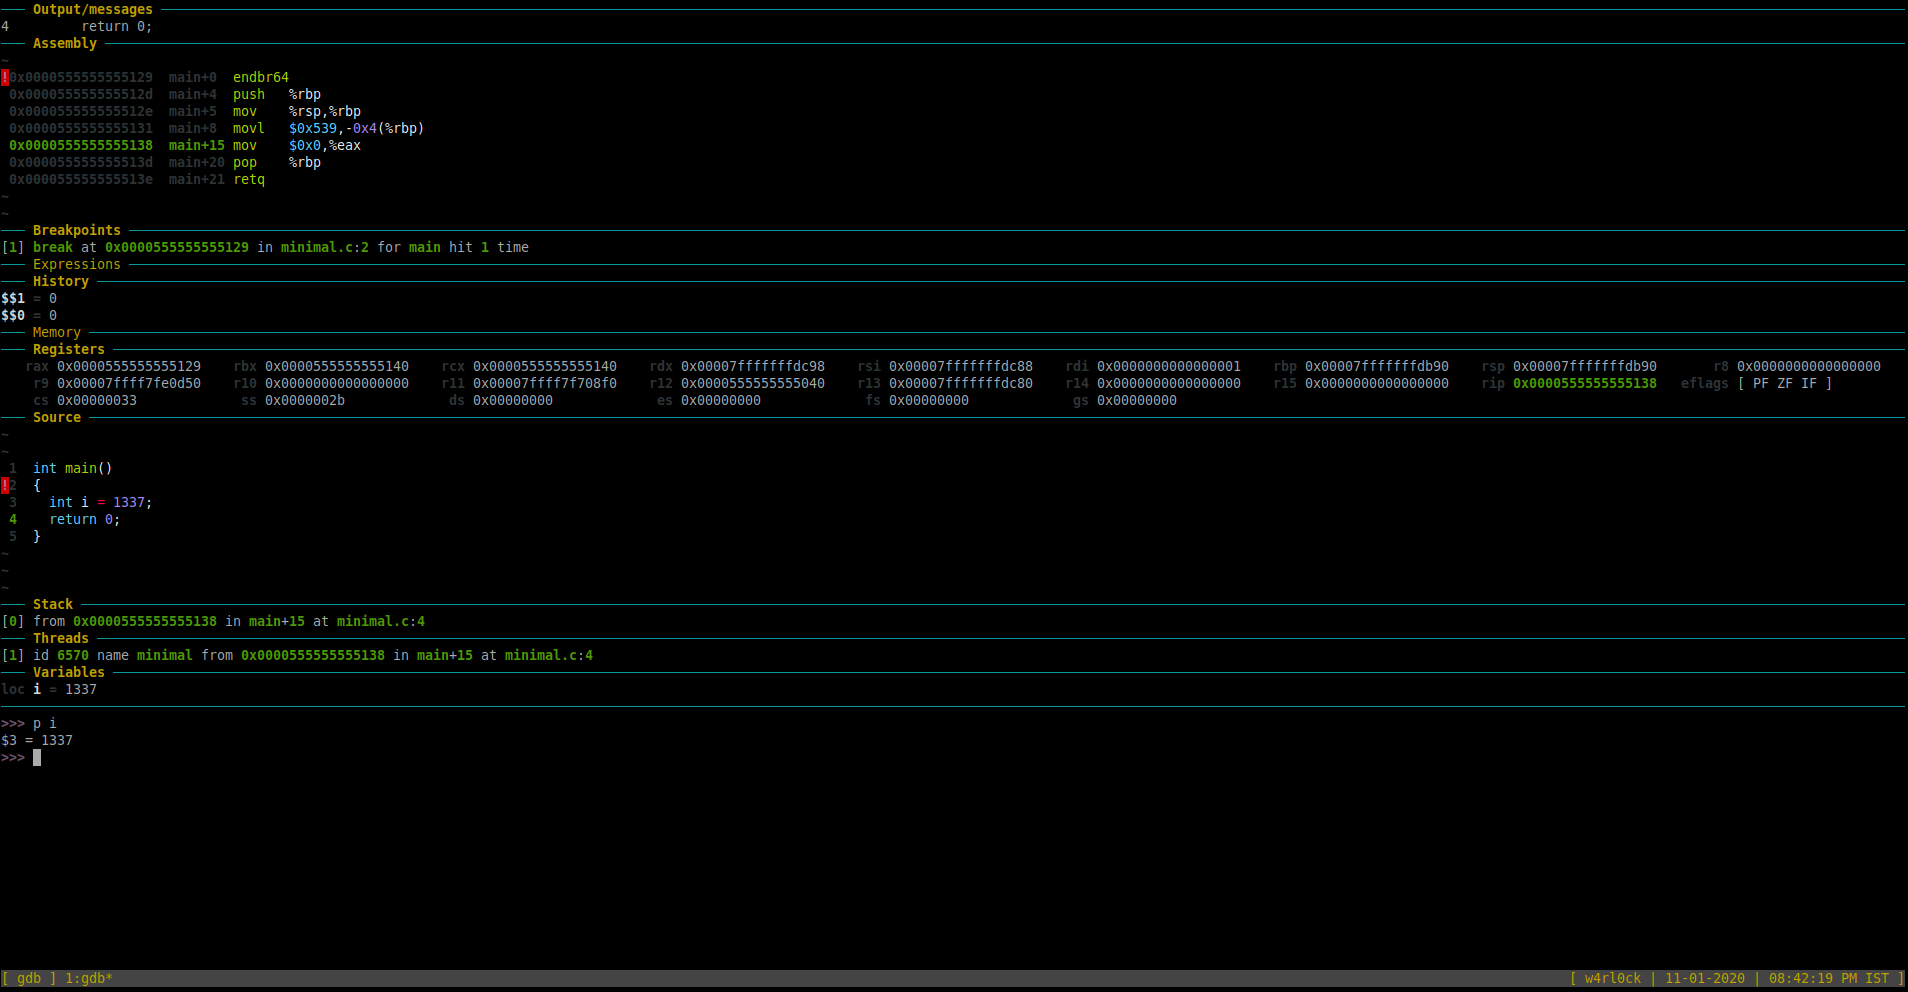
Run command “n” again in gdb. Now, checking the “Source” section in GDB dashboard, should that we are now on line 4.
Now. check the value of variable “i” using print.
>>> p i
$3 = 1337
This shows that the value variable “i” is 1337.
(gdb) print i
$2 = 1337
Here is the screenshot for reference.
To find the type of the variable and the starting memory address of that variable in memory:
>>> print &i
$4 = (int *) 0x7fffffffdb8c
-The above shows that “i” is of “int” type. Additionally, “i” is stored at memory location starting at address 0x7fffffffdb8c
-To check maximum size of int type in memory using the sizeof() function.
>>> p sizeof(int)
$5 = 4
The above output shows that int would occupy 4 bytes of space in memory.
To examine memory using gdb use “x“.
-From above outputs, we know that variable “i” is stored in memory with starting address as 0x7fffffffdb8c. We also do know that i is of type integer and integer type would occupy a maximum of 4 bytes in memory.
To examine a specific memory address, you could use the following format
(gdb) x/FMT <starting_memory_address>
Here is information from “help x” section:
(gdb) help x
Examine memory: x/FMT ADDRESS.
ADDRESS is an expression for the memory address to examine.
FMT is a repeat count followed by a format letter and a size letter.
Format letters are o(octal), x(hex), d(decimal), u(unsigned decimal),
t(binary), f(float), a(address), i(instruction), c(char), s(string)
and z(hex, zero padded on the left).
Size letters are b(byte), h(halfword), w(word), g(giant, 8 bytes).
The specified number of objects of the specified size are printed
according to the format. If a negative number is specified, memory is
examined backward from the address.

Defaults for format and size letters are those previously used.
Default count is 1. Default address is following last thing printed
with this command or "print".
(gdb)
Here, is an example, to examine data from memory location 0x7fffffffdb8c upto the next bytes (or 4 bytes above 0x7fffffffdb8c) , use the following:
>>> x/4xb 0x7fffffffdb8c
0x7fffffffdb8c: 0x39 0x05 0x00 0x00
Alternatively, you can access provide the memory location directly by passing “&i” i.e. “x/4xb &i”
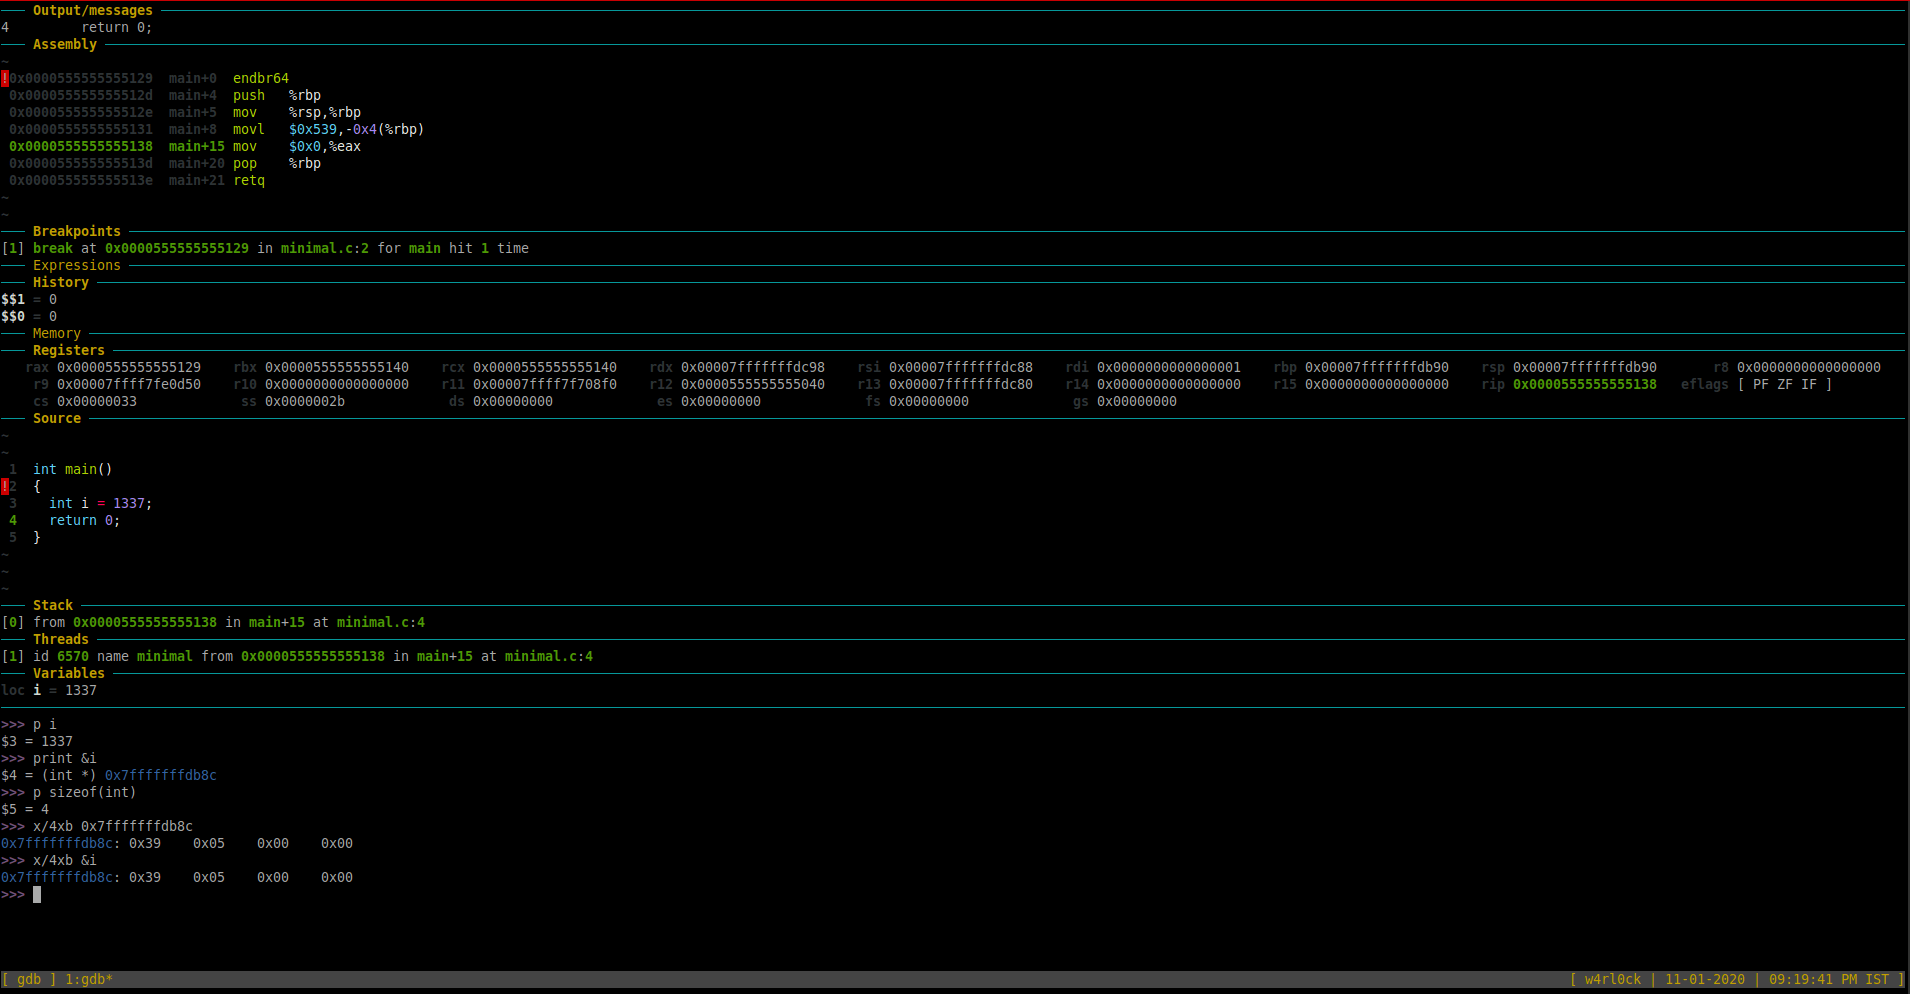
The above output shows raw byte by byte representation in memory. Here, 0x39 is one byte in memory and 0x05 is another byte etc.
We also know that int would occupy 4 bytes in memory. Here, this integer takes only 2 bytes out of 4 bytes in memory.
Important: This raw memory representation “0x39 0x05 0x00 0x00” is in “little-endian” format(the least significant bytes of a number come first in memory).
So, you would need to read the hex bytes “0x39 0x05 0x00 0x00” in reverse order. Hence, the value reversed 0x00 0x00 0x05 0x39 is 00000539.
To get the actual value, we need to convert the hex value to decimal.
You could use trusty bash to covert hex to decimal by using format “echo $(( 16#$hexNum ))“. Here is what it does look like:
extr3me@w4rl0ck:~$ echo $(( 16#00000539 ))
1337
So, “1337” is the decimal value stored in memory location 4 bytes starting from 0x7fffffffdb8c.
So, we now know the value of integer variable starting at memory location 0x7fffffffdb8c is 1337. (i.e. the decimal value of i stored in memory is 1337).
An alternative is to use a online hex to decimal converter such as https://www.binaryhexconverter.com/hex-to-decimal-converter to covert 00000539 to decimal.
-You can also print the raw data using the variable itself by using the following format:
(gdb) x/4xb &i

0x7fffffffdb5c: 0x39 0x05 0x00 0x00
Other formats in GDB:
-To print in decimal format, use x/1dw:
(gdb) x/1dw &i
0x7fffffffdb7c: 1337
-Alternatively, give the memory location as well.
(gdb) x/1dw 0x7fffffffdb7c
0x7fffffffdb7c: 1337
Misc Information:
To check the number of threads, run “info threads“.
>>> info threads
Id Target Id Frame
* 1 process 6570 "minimal" main () at minimal.c:4
>>>
This shows there is 1 thread with PID 6570.
Other Interesting Stuff:
Here is a screenshot of the dissembled code of “minimal” binary.
#gdb-assembly.png
The one that we are interested in for now is the instruction highlighted below:
0x0000555555555129 main+0 endbr64
0x000055555555512d main+4 push %rbp
0x000055555555512e main+5 mov %rsp,%rbp
0x0000555555555131 main+8 movl $0x539,-0x4(%rbp)
0x0000555555555138 main+15 mov $0x0,%eax
0x000055555555513d main+20 pop %rbp
0x000055555555513e main+21 retq
The instruction “movl $0x539,-0x4(%rbp)” means => move the value “0x539” to the memory location of register rbp -4.
Differences between AT&T and Intel Syntax:
By default, GDB defaults to displaying in AT&T syntax. Here is what main function dissembled looks like in AT&T syntax:
extr3me@w4rl0ck:gdb$ gdb minimal
GNU gdb (Ubuntu 9.2-0ubuntu1~20.04) 9.2
Copyright (C) 2020 Free Software Foundation, Inc.
License GPLv3+: GNU GPL version 3 or later <http://gnu.org/licenses/gpl.html>
This is free software: you are free to change and redistribute it.
There is NO WARRANTY, to the extent permitted by law.
Type "show copying" and "show warranty" for details.
This GDB was configured as "x86_64-linux-gnu".
Type "show configuration" for configuration details.
For bug reporting instructions, please see:
<http://www.gnu.org/software/gdb/bugs/>.
Find the GDB manual and other documentation resources online at:
<http://www.gnu.org/software/gdb/documentation/>.

For help, type "help".
Type "apropos word" to search for commands related to "word"...
Reading symbols from minimal...
>>> disass /m main
Dump of assembler code for function main:
2 {
0x0000000000001129 <+0>: endbr64
0x000000000000112d <+4>: push %rbp
0x000000000000112e <+5>: mov %rsp,%rbp

3 int i = 1337;
0x0000000000001131 <+8>: movl $0x539,-0x4(%rbp)

4 return 0;
0x0000000000001138 <+15>: mov $0x0,%eax

5 }
0x000000000000113d <+20>: pop %rbp
0x000000000000113e <+21>: retq

End of assembler dump.
>>>
-If you don’t like this syntax, you can make GDB use Intel syntax using “set disassembly-flavor intel“.
Here, is an example of main function dissasembled in Intel syntax:
extr3me@w4rl0ck:gdb$ gdb minimal
GNU gdb (Ubuntu 9.2-0ubuntu1~20.04) 9.2
Copyright (C) 2020 Free Software Foundation, Inc.
License GPLv3+: GNU GPL version 3 or later <http://gnu.org/licenses/gpl.html>
This is free software: you are free to change and redistribute it.
There is NO WARRANTY, to the extent permitted by law.
Type "show copying" and "show warranty" for details.
This GDB was configured as "x86_64-linux-gnu".
Type "show configuration" for configuration details.
For bug reporting instructions, please see:
<http://www.gnu.org/software/gdb/bugs/>.
Find the GDB manual and other documentation resources online at:
<http://www.gnu.org/software/gdb/documentation/>.

For help, type "help".
Type "apropos word" to search for commands related to "word"...
Reading symbols from minimal...
>>> set disassembly-flavor intel
>>> disass /m main
Dump of assembler code for function main:
2 {
0x0000000000001129 <+0>: endbr64
0x000000000000112d <+4>: push rbp
0x000000000000112e <+5>: mov rbp,rsp

3 int i = 1337;
0x0000000000001131 <+8>: mov DWORD PTR [rbp-0x4],0x539

4 return 0;
0x0000000000001138 <+15>: mov eax,0x0

5 }
0x000000000000113d <+20>: pop rbp
0x000000000000113e <+21>: ret

End of assembler dump.
>>>
Here, you should see subtle differences such as the AT&T syntax displays “movl $0x539,-0x4(%rbp)” while the same in Intel syntax is “mov DWORD PTR [rbp-0x4],0x539“.
Thats it for now. I will add more tutorials on GDB in the near future.
Happy Debugging!
Sources/References/Credits:
Below are all the credits/references/sources that made writing this blog post possible.
https://www.recurse.com/blog/5-learning-c-with-gdb <- Credits to recurse. I used this as my primary resource to learn GDB and then post my understanding of GDB and C here. Do check them out.
https://github.com/cyrus-and/gdb-dashboard <- Creator of the Epic GDB dashboard
https://www.tutorialspoint.com/gnu_debugger/ <- Great place to start.
https://sourceware.org/gdb/current/onlinedocs/gdb/Set-Breaks.html#Set-Breaks
https://stackoverflow.com/questions/209534/how-to-highlight-and-color-gdb-output-during-interactive-debugging
https://bob.cs.sonoma.edu/IntroCompOrg-RPi/sec-gdb1.html
https://www.binaryhexconverter.com <- Simple online convertor
https://stackoverflow.com/questions/13280131/hexadecimal-to-decimal-in-shell-script
https://www.ibm.com/developerworks/library/l-ia/index.html
Credits to my m8 @bytesareana for decoding the stuff with the memory location.
