Setup Wireguard VPN Server and Client in Ubuntu 20.04

This a guide on how to setup Wireguard VPN on Ubuntu and setting up a Wireguard client.

Requirements:

1. Ubuntu Server 20.04 used in my lab. (20.04 or higher is required for Policy routing)

2. Ubuntu Client (Ubuntu 20.04)

3. Root access to the server.

4. Network Access

Note: This should also work on Linux Mint 20.04

Setting up the Wireguard Server

Login to the In my lab, I have set up a EC2 instance and below is the current IP configuration before setting up Wireguard.

root@ip-172-31-20-229:~# ip a
1: lo: <LOOPBACK,UP,LOWER_UP> mtu 65536 qdisc noqueue state UNKNOWN group default qlen 1000
    link/loopback 00:00:00:00:00:00 brd 00:00:00:00:00:00
    inet 127.0.0.1/8 scope host lo
       valid_lft forever preferred_lft forever
    inet6 ::1/128 scope host 
       valid_lft forever preferred_lft forever
2: eth0: <BROADCAST,MULTICAST,UP,LOWER_UP> mtu 9001 qdisc fq_codel state UP group default qlen 1000
    link/ether 02:ca:92:5f:0e:80 brd ff:ff:ff:ff:ff:ff
    inet 172.31.20.229/20 brd 172.31.31.255 scope global dynamic eth0
       valid_lft 2617sec preferred_lft 2617sec
    inet6 fe80::ca:92ff:fe5f:e80/64 scope link 
       valid_lft forever preferred_lft forever

From above, I have a single interface with IP 172.31.20.229 assigned to eth0.

sudo apt update && sudo apt upgrade -y
sudo apt install wireguard -y

-Switch to root and run the following:

sudo su –

Below are the default permissions on the wireguard dir:

root@ip-172-31-20-229:~# ls -l /etc/ | grep wireguard
drwx------ 2 root root       4096 Aug  4  2020 wireguard

-You could set permissions to the directory as follows:

chmod 0700 /etc/wireguard/
root@ip-172-31-20-229:~# ls -l /etc/ | grep wireguard
drwx------ 2 root root       4096 Aug  4  2020 wireguard

To check the version of Wireguard installed:

root@ip-172-31-20-229:/etc/wireguard# wg --version
wireguard-tools v1.0.20200513 - https://git.zx2c4.com/wireguard-tools/

-Generate public and private key pairs:

cd /etc/wireguard/
umask 077; wg genkey | tee privatekey | wg pubkey > publickey

This should generate the private and the public key:

root@ip-172-31-20-229:/etc/wireguard# ls -l
total 8
-rw------- 1 root root 45 Jun 30 20:23 privatekey
-rw------- 1 root root 45 Jun 30 20:23 publickey

-Take a note of the private key “privatekeycat privatekey . You will need to add this to the WG server’s conf file.

Setting up the Wireguard Server’s configuration file

vim /etc/wireguard/wg0.conf

Add below content. (Here, I chose the IP as 192.168.6.1 which is the new VPN private address that will be assigned to the interface)

[Interface]
## My VPN server private IP address ##
Address = 192.168.6.1
 
## My VPN server port ##
ListenPort = 41194
 
## VPN server's private key i.e. string from /etc/wireguard/privatekey ##
PrivateKey = ADD_PRIVATE_KEY_HERE

-Allow the port in the Server’s Firewall:

root@ip-172-31-20-229:~# sudo ufw allow 41194/udp
Rules updated
Rules updated (v6)

-To check the status:

sudo ufw status

– Enable wireguard service on boot on the server and start the service:

ubuntu@ip-172-31-20-229:~$ sudo systemctl enable wg-quick@wg0
Created symlink /etc/systemd/system/multi-user.target.wants/[email protected] → /lib/systemd/system/[email protected].

ubuntu@ip-172-31-20-229:~$ sudo systemctl start wg-quick@wg0

To check the status of the wireguard service, use the following:

root@ip-172-31-20-229:~# sudo systemctl status wg-quick@wg0
[email protected] - WireGuard via wg-quick(8) for wg0
     Loaded: loaded (/lib/systemd/system/[email protected]; enabled; vendor preset: enabled)
     Active: active (exited) since Thu 2022-06-30 21:29:01 UTC; 8min ago
       Docs: man:wg-quick(8)
             man:wg(8)
             https://www.wireguard.com/
             https://www.wireguard.com/quickstart/
             https://git.zx2c4.com/wireguard-tools/about/src/man/wg-quick.8
             https://git.zx2c4.com/wireguard-tools/about/src/man/wg.8
    Process: 2230 ExecStart=/usr/bin/wg-quick up wg0 (code=exited, status=0/SUCCESS)
   Main PID: 2230 (code=exited, status=0/SUCCESS)

Jun 30 21:29:01 ip-172-31-20-229 systemd[1]: [email protected]: Succeeded.
Jun 30 21:29:01 ip-172-31-20-229 systemd[1]: Stopped WireGuard via wg-quick(8) for wg0.
Jun 30 21:29:01 ip-172-31-20-229 systemd[1]: Starting WireGuard via wg-quick(8) for wg0...
Jun 30 21:29:01 ip-172-31-20-229 wg-quick[2230]: [#] ip link add wg0 type wireguard
Jun 30 21:29:01 ip-172-31-20-229 wg-quick[2230]: [#] wg setconf wg0 /dev/fd/63
Jun 30 21:29:01 ip-172-31-20-229 wg-quick[2230]: [#] ip -4 address add 192.168.6.1/24 dev wg0
Jun 30 21:29:01 ip-172-31-20-229 wg-quick[2230]: [#] ip link set mtu 8921 up dev wg0
Jun 30 21:29:01 ip-172-31-20-229 systemd[1]: Finished WireGuard via wg-quick(8) for wg0.

Checking the ifconfig output, you would see a new interface wg0 is created automatically which is expected.

root@ip-172-31-20-229:~# ip a
1: lo: <LOOPBACK,UP,LOWER_UP> mtu 65536 qdisc noqueue state UNKNOWN group default qlen 1000
    link/loopback 00:00:00:00:00:00 brd 00:00:00:00:00:00
    inet 127.0.0.1/8 scope host lo
       valid_lft forever preferred_lft forever
    inet6 ::1/128 scope host 
       valid_lft forever preferred_lft forever
2: eth0: <BROADCAST,MULTICAST,UP,LOWER_UP> mtu 9001 qdisc fq_codel state UP group default qlen 1000
    link/ether 02:ca:92:5f:0e:80 brd ff:ff:ff:ff:ff:ff
    inet 172.31.20.229/20 brd 172.31.31.255 scope global dynamic eth0
       valid_lft 2235sec preferred_lft 2235sec
    inet6 fe80::ca:92ff:fe5f:e80/64 scope link 
       valid_lft forever preferred_lft forever
5: wg0: <POINTOPOINT,NOARP,UP,LOWER_UP> mtu 8921 qdisc noqueue state UNKNOWN group default qlen 1000
    link/none 
    inet 192.168.6.1/24 scope global wg0
       valid_lft forever preferred_lft forever

– You can check wireguard information/stats using the below command:

ubuntu@ip-172-31-20-229:~$ sudo wg
interface: wg0
  public key: pHrkGojLiNZy2GwshmdEXMaaOmowXXXXXXXXXXXXXXX=
  private key: (hidden)
  listening port: 41194

Configuring the VPN Client

  • Login to the client and install Wireguard.
sudo apt install wireguard -y

– Create the configuration file

root@wg-client:~# sudo sh -c 'umask 077; touch /etc/wireguard/wg0.conf'

root@wg-client:~# ls -l /etc/wireguard/wg0.conf 
-rw------- 1 root root 0 Jun 30 20:58 /etc/wireguard/wg0.conf
  • Create a key pair in the client

– In the client machine, create a key pair:

root@wg-client:~# cd /etc/wireguard/

root@wg-client:/etc/wireguard# umask 077; wg genkey | tee privatekey | wg pubkey > publickey

root@wg-client:/etc/wireguard# ls -l 
total 8
-rw------- 1 root root 45 Jun 30 21:01 privatekey
-rw------- 1 root root 45 Jun 30 21:01 publickey
-rw------- 1 root root  0 Jun 30 20:58 wg0.conf
root@wg-client:/etc/wireguard# 

– Take a note of the client’s public key. (This will be added in the server’s config later)

-Take a note of the private key from the client. This will be added in its own config file.

cat privatekey

– On the client, create the wireguard config file as below:

[Interface]
## Add the client's private key which is from /etc/wireguard/publickey ##
PrivateKey = CLIENT_PRIVATE_KEY_HERE
 
## Client ip address that will be set by this Client ##
Address = 192.168.6.2/24
  
[Peer]
## Ubuntu 20.04 server public key ##
PublicKey = SERVER_PUBLIC_KEY_HERE
 
## set ACL ##
AllowedIPs = 192.168.2.0/24
  
## Your Ubuntu 20.04 LTS server's public IPv4/IPv6 address and port ##
Endpoint = PUBLIC_IP_OF_YOUR_WIREGUARD_SERVER:41194
   
##  Key connection alive ##
PersistentKeepalive = 15

-On the client, enable and start the Wireguard service:

root@wg-client:/etc/wireguard# sudo systemctl enable wg-quick@wg0
Created symlink /etc/systemd/system/multi-user.target.wants/[email protected] -> /lib/systemd/system/[email protected].

root@wg-client:/etc/wireguard# sudo systemctl start wg-quick@wg0

– Check the status of the service in the client:

root@wg-client:~# sudo systemctl status wg-quick@wg0
* [email protected] - WireGuard via wg-quick(8) for wg0
     Loaded: loaded (/lib/systemd/system/[email protected]; enabled; vendor preset: enabled)
     Active: active (exited) since Thu 2022-06-30 21:35:17 UTC; 5min ago
       Docs: man:wg-quick(8)
             man:wg(8)
             https://www.wireguard.com/
             https://www.wireguard.com/quickstart/
             https://git.zx2c4.com/wireguard-tools/about/src/man/wg-quick.8
             https://git.zx2c4.com/wireguard-tools/about/src/man/wg.8
    Process: 123 ExecStart=/usr/bin/wg-quick up wg0 (code=exited, status=0/SUCCESS)
   Main PID: 123 (code=exited, status=0/SUCCESS)
        CPU: 28ms

Jun 30 21:35:17 wg-client systemd[1]: Starting WireGuard via wg-quick(8) for wg0...
Jun 30 21:35:17 wg-client wg-quick[123]: [#] ip link add wg0 type wireguard
Jun 30 21:35:17 wg-client wg-quick[123]: [#] wg setconf wg0 /dev/fd/63
Jun 30 21:35:17 wg-client wg-quick[123]: [#] ip -4 address add 192.168.6.2/24 dev wg0
Jun 30 21:35:17 wg-client wg-quick[123]: [#] ip link set mtu 1420 up dev wg0
Jun 30 21:35:17 wg-client systemd[1]: Finished WireGuard via wg-quick(8) for wg0.

-From the above output, we can see that the wireguard service has created the interface wg0 and assigned the IP 192.168.6.2/24 to it. You could also verify this by checking by checking the device ip conf as below:

root@wg-client:~# ip a
1: lo: <LOOPBACK,UP,LOWER_UP> mtu 65536 qdisc noqueue state UNKNOWN group default qlen 1000
    link/loopback 00:00:00:00:00:00 brd 00:00:00:00:00:00
    inet 127.0.0.1/8 scope host lo
       valid_lft forever preferred_lft forever
    inet6 ::1/128 scope host 
       valid_lft forever preferred_lft forever
2: eth0@if114: <BROADCAST,MULTICAST,UP,LOWER_UP> mtu 1500 qdisc noqueue state UP group default qlen 1000
    link/ether aa:3c:37:57:21:8a brd ff:ff:ff:ff:ff:ff link-netnsid 0
    inet 192.168.1.143/24 brd 192.168.1.255 scope global dynamic eth0
       valid_lft 86010sec preferred_lft 86010sec
    inet6 fe80::a83c:37ff:fe57:218a/64 scope link 
       valid_lft forever preferred_lft forever
3: wg0: <POINTOPOINT,NOARP,UP,LOWER_UP> mtu 1420 qdisc noqueue state UNKNOWN group default qlen 1000
    link/none 
    inet 192.168.6.2/24 scope global wg0
       valid_lft forever preferred_lft forever

So far, we can configured the client to talk to the server. But the Server does not know about the client. So, next we need to update the Server’s Wireguard configuration file with the details of the wireguard client.

-Login to the Wireguard Server and add the below block to the server’s wireguard conf:

[Peer]
## Desktop/client VPN public key ##
PublicKey = CLIENT_PUB_KEY_HERE

## client VPN IP address (note  the /32 subnet) ##
AllowedIPs = 192.168.6.2/32

-So, your Wireguard server’s configuration file will be as follows:

[Interface]
## My VPN server private IP address ##
Address = 192.168.6.1
 
## My VPN server port ##
ListenPort = 41194
 
## VPN server's private key i.e. /etc/wireguard/privatekey ##
PrivateKey = ADD_PRIVATE_KEY_HERE

[Peer]
## Desktop/client VPN public key ##
PublicKey = CLIENT_PUB_KEY_HERE

## client VPN IP address (note  the /32 subnet) ##
AllowedIPs = 192.168.6.2/32

– Start the service again on the server:

sudo systemctl start wg-quick@wg0

Verify connectivity from the client => server:

– If the server is in the cloud, then update the security groups tallow the port.

– From the client, ping the server 192.168.6.1

root@wg-client:~# ping 192.168.6.1
PING 192.168.6.1 (192.168.6.1) 56(84) bytes of data.
64 bytes from 192.168.6.1: icmp_seq=1 ttl=64 time=81.9 ms
64 bytes from 192.168.6.1: icmp_seq=2 ttl=64 time=82.5 ms
^C
--- 192.168.6.1 ping statistics ---
2 packets transmitted, 2 received, 0% packet loss, time 1001ms
rtt min/avg/max/mdev = 81.886/82.172/82.458/0.286 ms

Checking active connections from Wireguard server:

– To see which clients are connected to the server and the statistics, you can run the below:

root@ip-172-31-20-229:~# sudo wg
interface: wg0
  public key: pHrkGojLiNZy2GwshmdEXMaaOmowXXXXXXXXXXXXXXX=
  private key: (hidden)
  listening port: 41194

peer: 8Zp7Cji5Aseew3L0P3c35sUzJNIPYYYYYYYYYYYYYYY=
  endpoint: 1.2.3.4:33395
  allowed ips: 192.168.6.2/32
  latest handshake: 1 minute, 12 seconds ago
  transfer: 3.94 KiB received, 1.47 KiB sent


Additional Information:

For debugging issue with wireguard, you could check the logs:

sudo journalctl -eu wg-quick@wg0

Here is a little cronjob to monitor the tunnel via ping and restart tunnel: (Credits to linuxbabe)

sudo crontab -e

-Add the below:

SHELL=/bin/bash
* * * * * for ((i=1; i<=6; i++)) do (ping -c9 192.168.6.1 > /dev/null || systemctl restart wg-quick@wg0) done

Hope this helps! Cheers!

Sources/References:

https://www.cyberciti.biz/faq/ubuntu-20-04-set-up-wireguard-vpn-server/

Set Up Your Own WireGuard VPN Server on Ubuntu 22.04/20.04/18.04

Hexadecimal basics using basic Linux utilities

This is short guide on how to convert strings and decimal values to hexadecimal and vice-versa using simple Linux utilities such as xxd and printf.

  1. To convert a string to hexadecimal, you can use xxd in Linux.

For example: To convert a string “kali” to hexadecimal, you can use the below format.

extr3me@op3n:~$ echo -n kali | xxd
00000000: 6b61 6c69 kali

To group and display the output a single character at a time, use -c  flag with argument 1.

extr3me@op3n:~$ echo -n kali | xxd -c1
00000000: 6b k
00000001: 61 a
00000002: 6c l
00000003: 69 i

This means the following:

00000000: 6b k <- k is a single character and its hexadecimal value is 6b
00000001: 61 a <- a is a single character and its hexadecimal value is 61
00000002: 6c l <- l is a single character and its hexadecimal value is 6c
00000003: 69 i <- i is a single character and its hexadecimal value is 69

2. Convert Hexadecimal value back to string:

extr3me@op3n:~$ echo -n "6b61 6c69" | xxd -r -p
kali

Dont worry about the spaces, it should still work.

extr3me@op3n:~$ echo -n "6b616c69" | xxd -r -p
kaliextr3me@op3n:~$

3. Convert decimal (number) to hexadecimal

-Lets say you want to convert number 12 to decimal value. To do so, you could use printf as shown below.

extr3me@op3n:~$ printf "%x\n" 12
c

From above output, the hexadecimal value for number 12 (aka decimal 12) is character c.

To find hexadecimal values for values from 1 to 255, you could run through it in a loop

for num in {1..255}; do printf "%x\n" $num ; done | less

Hope these help.

PS: Knowing hexadecimal does come in handy while learning/debugging different protocols.

GDB basics with C

This is a beginner level tutorial on learning basics of debugging using GDB by debugging an executable. This post will cover writing a very simple C code, compiling it and then opening the generated executable in GDB for inspecting the working/debugging. The primary objective here is to get familiar with the basics of using GDB.

Requirements:

  1. Any Linux x64 OS. (Linux Mint 20 used in this tutorial)
  2. C compiler – gcc
  3. gdb – for debugging / reverse engineering.
  4. GDB Dashboard (Optional – Makes GDB easier to read)

[Disclaimer: This is blog post adapted from recurse’s original gdb tutorial.(All Credits/References added in the Credits section)]

Setting up the Environment:

  • Install the following tools to setup the basic environment:

sudo apt install vim gcc gdb git python3 python3-pip -y

GDB Dashboard:

  • To make GDB easier to understand and make it non-alien, use GDB Dashboard which is a really good python plugin  for GDB.  Its epic!
  • Run the following to get the gdbinit dotfile.
wget -P ~ https://git.io/.gdbinit

If you would like to check out the source, you can find it  @ https://github.com/cyrus-and/gdb-dashboard

For syntax highlighting, you would need the pygments module. If you are using Python2.x:

pip install pygments

If you are using Python3.x, then use pip3 to install it:

pip3 install pygments

To run gdb without providing any executable, run “gdb” and you should see the something like below:

extr3me@w4rl0ck:gdb$ gdb
GNU gdb (Ubuntu 9.2-0ubuntu1~20.04) 9.2
Copyright (C) 2020 Free Software Foundation, Inc.
License GPLv3+: GNU GPL version 3 or later <http://gnu.org/licenses/gpl.html>
This is free software: you are free to change and redistribute it.
There is NO WARRANTY, to the extent permitted by law.
Type "show copying" and "show warranty" for details.
This GDB was configured as "x86_64-linux-gnu".
Type "show configuration" for configuration details.
For bug reporting instructions, please see:
<http://www.gnu.org/software/gdb/bugs/>.
Find the GDB manual and other documentation resources online at:
    <http://www.gnu.org/software/gdb/documentation/>.

For help, type "help".
Type "apropos word" to search for commands related to "word".
>>> 

To exit out of gdb, type  “quit” .

-Below is a simple C program that initializes an integer value and then returns 0.

cat minimal.c
int main()
{
int i = 1337;
return 0;
}

-Compile the C code and make an executable, using the following flags:

gcc -g minimal.c -o minimal

-The directory should now have a executable with filename minimal.

extr3me@w4rl0ck:gdb$ file minimal
minimal: ELF 64-bit LSB shared object, x86-64, version 1 (SYSV), dynamically linked, interpreter /lib64/ld-linux-x86-64.so.2, BuildID[sha1]=c918c072d119be6a9d18991e812a5414ecae67e1, for GNU/Linux 3.2.0, with debug_info, not stripped

Debugging the binary using GDB:

-To examine an executable in GDB, use the following format:

gdb <executable_file>

-Here, I would run the following to open the executable for debugging:

gdb minimal

gdb minimal output

Lets check the functions in this program, to do run “info functions”. You should be able to see that this executable has function main().

>>> info functions
All defined functions:

File minimal.c:
1: int main();

Non-debugging symbols:
0x0000000000001000 _init
0x0000000000001030 __cxa_finalize@plt
0x0000000000001040 _start
0x0000000000001070 deregister_tm_clones
0x00000000000010a0 register_tm_clones
0x00000000000010e0 __do_global_dtors_aux
0x0000000000001120 frame_dummy
0x0000000000001140 __libc_csu_init
0x00000000000011b0 __libc_csu_fini
0x00000000000011b8 _fini
Here is a screenshot:

gdb info functions output screenshot

The output also shows that the line number at which main() function is present in the source minimal.c.

From the info functions output, we can also see that function main() is present at line number 1 in source minimal.c.

Breakpoints:

-Lets say we need to examine what a executable is going at a given point of time or to inspect the value of a variable, then we can set one or more breakpoints and run the code upto that breakpoint. You can then examine the the value of a variable upto that breakpoint or directly examine the memory etc.

Breakpoints example: Setting breakpoints using function name

From the previous section,we know that the executable has function main(). Lets start examining the binary using gdb to see the value of “i” at different stages of the execution. To start with,  set a breakpoint at function main using the syntax break <function_name>:

>>> break main
Breakpoint 1 at 0x1129: file minimal.c, line 2.
>>>

To get the list of breakpoints that were set, you can use “info breakpoints”.

>>> info breakpoints
Num Type Disp Enb Address What
1 breakpoint keep y 0x0000000000001129 in main at minimal.c:2

gdb info breakpoints

The above shows that there is one breakpoint which is set at function main() whose starting address in memory is “0x1129” or “0x0000000000001129“.

Note: You can have create multiple breakpoints and they are numbered.

So we have a breakpoint in place, we can run the binary upto the breakpoint that was set. To run the program, use “run” or “r“.

gdb screenshot

This is what it looks like now. (You could now see the GDB dashboard with an insane amount of matrix looking stuff. :P)

[Note:  Right click the image and click on “View Image” / “Open image in new tab” if the image for better visibility. ]

GDB Dashboard screenshot

For this tutorial, we are more interested in few sections of Dashboard as of now –   “Source” , “Threads”, “Variables” and “Assembly” sections.

-The “Source” section has a blip on the line number which shows where exactly in the code where gdb is looking into. So, here, it shows that its in line 2 of the source. After you ran the program, if you re-run “info breakpoints” you can see that the message “breakpoint already hit 1 time“.

>> info breakpoints
Num Type Disp Enb Address What
1 breakpoint keep y 0x0000555555555129 in main at minimal.c:2
breakpoint already hit 1 time


[Note:  Right click the image and click on “View Image” / “Open image in new tab” if the image for better visibility. ]

As of now, the debugger is in line 2 where the variable “i” is not yet yet initiated in the program. So, if you try to print the value of “i”, then it should show a value = 0.

To print value of a variable, use the format “print var” or “p var“.

>> p i
$1 = 0


print i output screenshot

To go to the next line of code and execute it, use command “next” or “n“.  [Note: If the next line of code was a function, it would execute the full function). In this example, once we ran “r“, the “Source” section now highlights line number 3.

gdb print i screenshot 2

At this point, if you print variable “i”, it still shows value as “0” as the initialization is not complete.

You can also check the “Assembly” section in the GDB Dashboard which shows the disassembled code. So, the highlighted section in green in the  “Assembly” shows the following:

0x0000555555555131 main+8 movl $0x539,-0x4(%rbp)

This is the disassembled code (in AT&T syntax) for “int i = 1337”. We will come back to reviewing the assembly code later.

Run command “n” again in gdb. Now, checking the “Source” section in GDB dashboard, should that we are now on line 4.

Now. check the value of  variable “i” using print.

>>> p i
$3 = 1337

This shows that the value variable “i” is 1337.

(gdb) print i
$2 = 1337

Here is the screenshot for reference.

GDB print i after initialized

To find the type of the variable and the starting memory address of that variable in memory:
>>> print &i
$4 = (int *) 0x7fffffffdb8c

GDB print directly using variable address output

-The above shows that “i” is of “int” type. Additionally, “i” is stored at memory location starting at address 0x7fffffffdb8c

-To check maximum size of int type in memory using the sizeof() function.

>>> p sizeof(int)
$5 = 4

The above output shows that int would occupy 4 bytes of space in memory.

To examine memory using gdb use “x“.

-From above outputs, we know that variable “i” is stored in memory with starting address as 0x7fffffffdb8c. We also do know that i is of type integer and integer type would occupy a maximum of 4 bytes in memory.

To examine a specific memory address, you could use the following format

(gdb) x/FMT <starting_memory_address> 

Here is information from “help x” section:

(gdb) help x
Examine memory: x/FMT ADDRESS.
ADDRESS is an expression for the memory address to examine.
FMT is a repeat count followed by a format letter and a size letter.
Format letters are o(octal), x(hex), d(decimal), u(unsigned decimal),
t(binary), f(float), a(address), i(instruction), c(char), s(string)
and z(hex, zero padded on the left).
Size letters are b(byte), h(halfword), w(word), g(giant, 8 bytes).
The specified number of objects of the specified size are printed
according to the format. If a negative number is specified, memory is
examined backward from the address.

Defaults for format and size letters are those previously used.
Default count is 1. Default address is following last thing printed
with this command or "print".
(gdb)

Here, is an example, to examine data from memory location 0x7fffffffdb8c upto the next bytes (or 4 bytes above 0x7fffffffdb8c) ,  use the following:

>>> x/4xb 0x7fffffffdb8c
0x7fffffffdb8c: 0x39 0x05 0x00 0x00

Alternatively, you can access provide the memory location directly by passing “&i” i.e.  “x/4xb &i”

GDB examine memory location screenshot

The above output shows raw byte by byte representation in memory. Here, 0x39 is one byte in memory and 0x05 is another byte etc.
We also know that int would occupy 4 bytes in memory. Here, this integer takes only 2 bytes out of 4 bytes in memory.

Important: This raw memory representation “0x39 0x05 0x00 0x00” is in “little-endian” format(the least significant bytes of a number come first in memory).
So, you would need to read the hex bytes  “0x39 0x05 0x00 0x00” in reverse order. Hence, the value reversed 0x00 0x00 0x05 0x39 is 00000539.
To get the actual value, we need to convert the hex value to decimal.

You could use trusty bash  to covert hex to decimal by using format “echo $(( 16#$hexNum ))“. Here is what it does look like:

extr3me@w4rl0ck:~$ echo $(( 16#00000539 ))
1337

So, “1337” is the decimal value stored in memory location 4 bytes starting from 0x7fffffffdb8c.

So, we now know the value of integer variable starting at memory location 0x7fffffffdb8c is 1337. (i.e. the decimal value of i stored in memory is 1337).

An alternative is to use a online hex to decimal converter such as https://www.binaryhexconverter.com/hex-to-decimal-converter to covert 00000539 to decimal.

-You can also print the raw data using the variable itself by using the following format:

(gdb) x/4xb &i

0x7fffffffdb5c: 0x39 0x05 0x00 0x00

Other formats in GDB:

-To print in decimal format, use x/1dw:

(gdb) x/1dw &i
0x7fffffffdb7c: 1337

-Alternatively, give the memory location as well.

(gdb) x/1dw 0x7fffffffdb7c
0x7fffffffdb7c: 1337

Misc Information:

To check the number of threads, run “info threads“.

>>> info threads
Id Target Id Frame 
* 1 process 6570 "minimal" main () at minimal.c:4
>>> 

This shows there is 1 thread with PID 6570.

Other Interesting Stuff:

Here is a screenshot of the dissembled code of “minimal” binary.

#gdb-assembly.png

The one that we are interested in for now is the instruction highlighted below:

0x0000555555555129 main+0 endbr64
0x000055555555512d main+4 push %rbp
0x000055555555512e main+5 mov %rsp,%rbp
0x0000555555555131 main+8 movl $0x539,-0x4(%rbp)
0x0000555555555138 main+15 mov $0x0,%eax
0x000055555555513d main+20 pop %rbp
0x000055555555513e main+21 retq

The instruction “movl $0x539,-0x4(%rbp)” means => move the value “0x539” to the memory location of register rbp -4.

Differences between AT&T and Intel Syntax:

By default, GDB defaults to displaying in AT&T syntax. Here is what main function dissembled looks like in AT&T syntax:

extr3me@w4rl0ck:gdb$ gdb minimal
GNU gdb (Ubuntu 9.2-0ubuntu1~20.04) 9.2
Copyright (C) 2020 Free Software Foundation, Inc.
License GPLv3+: GNU GPL version 3 or later <http://gnu.org/licenses/gpl.html>
This is free software: you are free to change and redistribute it.
There is NO WARRANTY, to the extent permitted by law.
Type "show copying" and "show warranty" for details.
This GDB was configured as "x86_64-linux-gnu".
Type "show configuration" for configuration details.
For bug reporting instructions, please see:
<http://www.gnu.org/software/gdb/bugs/>.
Find the GDB manual and other documentation resources online at:
<http://www.gnu.org/software/gdb/documentation/>.

For help, type "help".
Type "apropos word" to search for commands related to "word"...
Reading symbols from minimal...
>>> disass /m main
Dump of assembler code for function main:
2 {
0x0000000000001129 <+0>: endbr64
0x000000000000112d <+4>: push %rbp
0x000000000000112e <+5>: mov %rsp,%rbp

3 int i = 1337;
0x0000000000001131 <+8>: movl $0x539,-0x4(%rbp)

4 return 0;
0x0000000000001138 <+15>: mov $0x0,%eax

5 }
0x000000000000113d <+20>: pop %rbp
0x000000000000113e <+21>: retq

End of assembler dump.
>>>

-If you don’t like this syntax, you can make GDB use Intel syntax using “set disassembly-flavor intel“.

Here, is an example of main function dissasembled in Intel syntax:

extr3me@w4rl0ck:gdb$ gdb minimal
GNU gdb (Ubuntu 9.2-0ubuntu1~20.04) 9.2
Copyright (C) 2020 Free Software Foundation, Inc.
License GPLv3+: GNU GPL version 3 or later <http://gnu.org/licenses/gpl.html>
This is free software: you are free to change and redistribute it.
There is NO WARRANTY, to the extent permitted by law.
Type "show copying" and "show warranty" for details.
This GDB was configured as "x86_64-linux-gnu".
Type "show configuration" for configuration details.
For bug reporting instructions, please see:
<http://www.gnu.org/software/gdb/bugs/>.
Find the GDB manual and other documentation resources online at:
<http://www.gnu.org/software/gdb/documentation/>.

For help, type "help".
Type "apropos word" to search for commands related to "word"...
Reading symbols from minimal...
>>> set disassembly-flavor intel
>>> disass /m main
Dump of assembler code for function main:
2 {
0x0000000000001129 <+0>: endbr64
0x000000000000112d <+4>: push rbp
0x000000000000112e <+5>: mov rbp,rsp

3 int i = 1337;
0x0000000000001131 <+8>: mov DWORD PTR [rbp-0x4],0x539

4 return 0;
0x0000000000001138 <+15>: mov eax,0x0

5 }
0x000000000000113d <+20>: pop rbp
0x000000000000113e <+21>: ret

End of assembler dump.
>>>

Here, you should see subtle differences  such as the AT&T syntax displays “movl $0x539,-0x4(%rbp)” while the same in Intel syntax is “mov DWORD PTR [rbp-0x4],0x539“.

Thats it for now. I will add more tutorials on GDB in the near future.

Happy Debugging!

Sources/References/Credits:

Below are all the credits/references/sources that made writing this blog post possible.

https://www.recurse.com/blog/5-learning-c-with-gdb <- Credits to recurse. I used this as my primary resource to learn GDB and then post my understanding of GDB and C here. Do check them out.
https://github.com/cyrus-and/gdb-dashboard <- Creator of the Epic GDB dashboard
https://www.tutorialspoint.com/gnu_debugger/ <- Great place to start.
https://sourceware.org/gdb/current/onlinedocs/gdb/Set-Breaks.html#Set-Breaks
https://stackoverflow.com/questions/209534/how-to-highlight-and-color-gdb-output-during-interactive-debugging
https://bob.cs.sonoma.edu/IntroCompOrg-RPi/sec-gdb1.html
https://www.binaryhexconverter.com <- Simple online convertor
https://stackoverflow.com/questions/13280131/hexadecimal-to-decimal-in-shell-script
https://www.ibm.com/developerworks/library/l-ia/index.html
Credits to my m8 @bytesareana for decoding the stuff with the memory location.

How to display a file from one line number to another in Linux

If you need to read a file and print from a range of line numbers (including the last one), you can use the command as shown below.

cat <filename> | awk 'NR >=linenumber1 && NR <=linenumber2'

To read and display a file along with the line numbers, you can use the following format:.

cat -n <filename>

Example:

cat -n sample.txt

display line number
For example:

To print lines starting from line 2 to line 7, then you can use the following command.

cat sample.txt | awk 'NR >=2 && NR <=7'

Sample Output:

use cat and awk to print range of line numbers in linux
If for any reason you need to display the line numbers along with the output, then you can pass the -n argument to cat before piping it to awk as shown below.

cat -n sample.txt | awk 'NR >=2 && NR <=7'

Sample Output:

print with line numbers

[Note: There are multiple methods to do the same procedure. This method is intended for beginners who are just getting started in Linux.]

Hope this helps!

If this article helped you, do leave a comment below and like us on Twitter and Facebook. Cheers!

Source: Link

Install Kali Linux in virtualbox (using ova file)

This is how I installed Kali Linux in virtualbox using the ova file method in my windows 10 PC along with its screenshots.

Requirements:

  1. Kali Linux 2019.1 Preinstalled ImageDownload Link (Torrent)  (~3.2 GB) [Updated link o latest Kali Version]
  2. VirtualBox: Download Link (~200 MB)
  3. CPU that supports Virtualization.
  4. Atleast 8GB of free disk space
  5. 7-zip: Download Link (~1.4 MB) [ Note: Winrar is another alternative you could use instead of 7-zip.]
  6. Virtual Box Extension Pack: Download Link (~22 MB) [Optional]

Installation Procedure:

The first thing you need to do is go ahead download and install Virtualbox in your system. Then download the Kali Linux ova file mentioned above and extract it using 7-zip or Winrar. The extracted file would be a .ova file format which is a pre-installed Kali Linux machine. Using a pre-installed file saves us a lot of time as we don’t have to go through the whole installation process.

Now, open VirtualBox:

open virtualbox

Then click on “File” and then click on “Import Appliance“.

click file import appliance

Click on the folder icon as shown below.

import ova file window

Now, browse to and select the extract .ova Kali Linux image file and click on “Open“.

select kali linux ova file

You would now see a window called “Appliance settings” where you can configure stuff like the name of your VM, the amount of RAM to be allocated to your Kali Linux VM etc.

kali linux appliance settings

If you want to change the name of the VM, simply click on the text and you can change it according to your will.

changing vm name

Finally, click on “Import” and wait for a few moments to import the Kali Linux Appliance.

click import to load kali linux appliance

importing kali linux appliance progress bar

Now, right click on your Kali Linux Virtual machine as shown below and click on “Settings“.

open kali linux virtual machine Settings

If you need to adjust the amount of RAM, click on “System” and you can move the slider accordingly. I would suggest atleast a minimum of 2048 MB (2GB) of RAM.

select ram for your Kali Linux VM

Now, click on “Network” as shown below and select “Bridged Adapter” and then click on “OK“.

Select Kali Linux network mode to Bridged Adapter

Click on your Kali Linux VM and then click on Start as shown below.

start kali linux in virtualbox

You should now be able to see the grub menu. Hit “Enter” in your keyboard.

kali linux grub menu

Now, login to your Kali Linux machine with the default username as root and password toor.

Note: If you are using newer Kali versions (from year 2020 ), the username and password is “kali”.

Ref: https://www.kali.org/docs/introduction/default-credentials/

kali username

kali password

You should now be booted into your Kali Linux desktop.

kali linux logged in

Customize Kali (Optional): 

I would like to make some minor changes to make sure the VM is not interrupted during pen testing. This section is purely optional, you can skip to the next section if you don’t want to customize it.

Click on the triangle pointing downwards in the upper right corner and then click on the “Settings” icon.

Kali Linux drop down menu

This will bring you the “All Settings” window as shown below. Click on “Date & Time“.

all settings menu

You can change the time zone to your time zone.

change time zone

Now, go back to the “All Settings” window and then click on “Privacy“.

select privacy in all setting menu

You would see a screen similar to the one below:

default privacy settings

Now, disable “Automatic Screen Lock” by moving the slider.

disable auto screen lock

Go back to “All Settings“, then click on “Power“.

click on power in all settings

Now, select Blank Screen option as “Never” and turn off  “Automatic Suspend” as shown below.

disable blank screen and automatic suspend

Update Kali Linux:

Open the terminal window by clicking on the icon as shown below:

open terminal

This is what the terminal window would look like in a Kali Linux system.

Kali Linux Terminal

Enter the following commands in the terminal to update your Kali Linux system.

apt-get clean && apt-get update -y
apt-get upgrade -y && apt-get dist-upgrade -y

This may take a while depending on your internet connection for the update to complete.

And that is it for setting up Kali Linux in virtualbox to get started with pentesting (only for ethical hacking and for purely educational purposes).

If you have any sort of queries regarding this installation, just leave a comment and will get back to you. I will be posting some ethical hacking tutorials in the future, so stay tuned.

How to install apache from source in Centos 6.7

This is a simple guide on how to configure Apache from source in Centos 6.7 + installing APR, APR-UTIL and PCRE to make it work.

Step 1. Install gcc:

Open up your terminal window and type the following command:

yum install gcc gcc-c++

Now, change to following directory:

cd /usr/src/

Step 2: Download and configure APR :

To download the APR file, use the below command:

wget http://a.mbbsindia.com//apr/apr-1.5.2.tar.gz

Now extract the downloaded file:

tar -zxvf apr-1.5.2.tar.gz

Change to the extracted folder and run the following commands to configure apr:

cd apr-1.5.2
./configure –prefix=/usr/src/apr
make
make install

Step 3. Download and configure apr-utils:

Change to following /usr/src/ directory:

cd /usr/src/

To download the APR-UTIL file, use the below command:

wget http://mirror.fibergrid.in/apache//apr/apr-util-1.5.4.tar.gz

To extract file, change to extracted folder and to configure apr, run the following commands:

tar -zxvf apr-util-1.5.4.tar.gz

cd apr-util-1.5.4
./configure –prefix=/usr/src/apr-util –with-apr=/usr/src/apr/
make
make install

Step 4. Download and config PCRE:

Change to /usr/src/ directory:

cd /usr/src/

To download pcre2-10.21.tar.gz type the following your terminal:

wget ftp://ftp.csx.cam.ac.uk/pub/software/programming/pcre/pcre2-10.21.tar.gz

To extract file, change to extracted folder and to configure pcre2-10.21, run the following commands:

tar -zxvf pcre2-10.21.tar.gz

cd pcre2-10.21
./configure –prefix=/usr/src/pcre2
make
make install

Step 5. Download Apache / httpd:

Now, change to following directory:

cd /usr/src/

To download httpd tar ball type the following your terminal:

wget http://a.mbbsindia.com//httpd/httpd-2.4.18.tar.gz

To extract file, change to extracted folder and to configure httpd, run the following commands:

tar -zxvf httpd-2.4.18.tar.gz

cd httpd-2.4.18
./configure –prefix=/usr/local/apache2 –with-apr=/usr/src/apr –with-apr-util=/usr/src/apr-util –with-pcre=/usr/src/pcre2/bin/pcre2-config
make
make install

Step 6. Start and test your apache server 

service httpd start
httpd -v

You can also open your browser and go to:

http://localhost/

And it should give you the Apache Welcome page.

And Voila! You have successfully configured apache from source. Hope this helps!

[DISCLAIMER: This guide is strictly for the purpose of learning how to configure apache from source for beginners. This should not to be used in a real production server as no security measures has been discussed or implemented in this tutorial.]

If you liked this article, do leave a comment below. You can also share this article by clicking on the social media buttons below. 

Source: ApacheTroubleshooting source: APR troubleshooting

How to setup Cloudflare CDN with Bigrock (manually) + Screenshots

This is a guide on how to setup Cloudflare CDN with BigRock (similar for Bluehost,Godaddy, Dreamhost, Hostgator) for your website or blog . You can follow the steps below:

Step 1. Create an account with Cloudflare:

Go to https://www.cloudflare.com and click on the “Signup” button.


cloudlare signup

Fill in your details, tick on “Agree” and then click on “Create Account“.

cloudflare create account

Step 2. Add your website

Now, in the text box below, type your website address and then click on “Scan DNS Records“as shown below.

cloudflare add site and scan dns

It will take a few moments for the scanning to complete.


cloudflare scanning dns records

Once, the scanning is complete, click on “Continue“.


cloudflare dns scanning complete

Now, click on “Continue” in the bottom corner:

cloudflare click continue


Step 3. Select Cloudflare Plan

Now, select the “Free Website” package as shown below and click on “Continue“.


select cloudflare free plan

Step 4. Get new name servers

Now, you will see the Cloudflare name servers as shown below. [This may vary for your website]

cloudflare name servers

As you see, for my website it is requesting to change the name server from

dns1.bigrock.in to linda.ns.cloudflare.com
dns2.bigrock.in to rob.ns.cloudflare.com

Also, also to remove the following nameservers:

dns3.bigrock.in 
dns4.bigrock.in 

[Note: The nameservers that you may see in your screen may be different.]

Step 4: Change your name servers to Cloudflare

Now, open up a new tab and login to your domain host panel (i.e. from where you bought your domain name from eg BigRock, Goddady, Hostgator, Bluehost etc). I have my domain from BigRock so I will be loggin in to my Bigrock account.

domain hosting bigrock login

Now, click on the domain you need to change the name servers to.


bigrock select domain

Now, click on “Name Servers” 


bigrock manage name servers


And you will see your default nameservers as shown below:

default bigrock name servers

Now, change your nameserver to the ones provided by cloudflare. In my case, after changing the nameserver, it will look like this:


cloudflare nameservers update

Now, click on “Update Name Servers“.

domain bigrock nameserver change success

Step 5: Verify in Cloudflare

Now, go back to your cloudflare tab and click on “Continue“.

cloudflare dns nameserver

It should show you show you a green banner with the status: “Active” as shown below.


cloudflare cdn active status
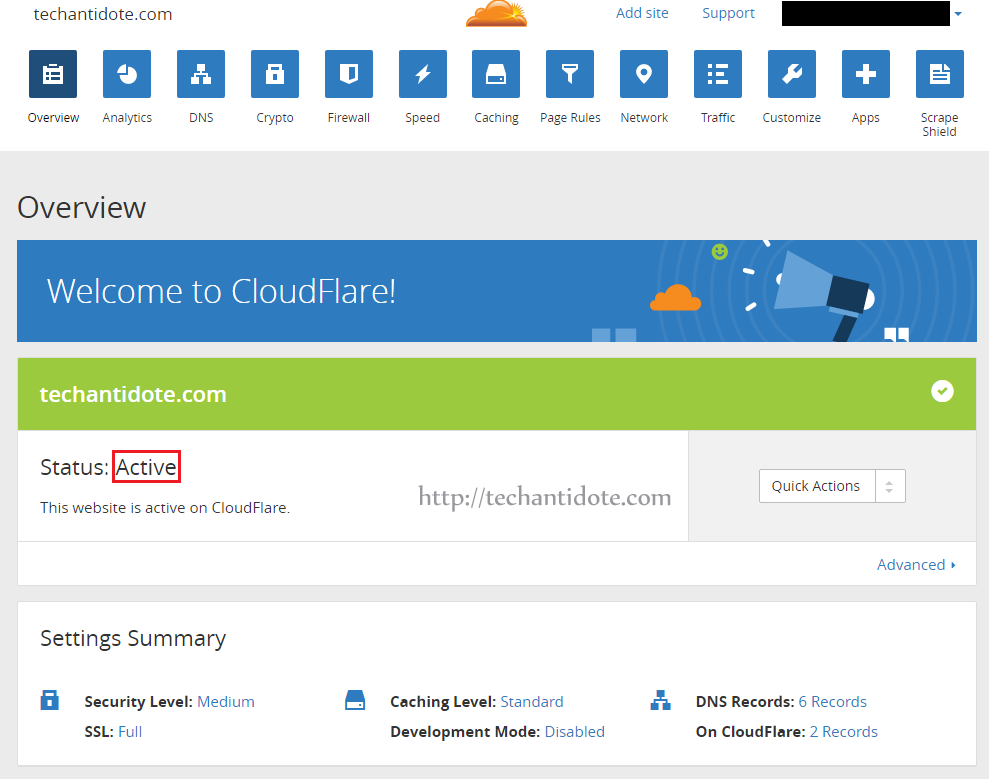
[NOTE: If you the status does not show as “Active” then you can click on “Recheck Status” and it then should show that its “Active”]

[IMPORTANT: It would take about 24-48 hours for the DNS to get updated.]

And Voila! You have successfully configured Cloudflare CDN for your blog/website and should load faster.

Do check the  performance of your website after 24-48 hours and let me know in the comments sections below if there was any speed improvement.

If this article helped you, then support us by liking us  us on FacebookTwitterGoogle+ and  Tumbler. 🙂

Regards,
ΞXΤЯ3МΞ